The Benfield process is a method deployed for removing CO2 and H2S from industrial and natural gases.
The key application fields are:
- Natural gas treatment for achieving liquid natural gas (LNG) or pipelne specification
- Recycle gas purification in ethylene oxide facilities
- Synthesis gas treatment for CO2 removal in iron ore direct reduction plants
- Synthesis gas treatment for CO2 removal in ammonia plants
Figure 1 shows the schematic of the Benfield process. The two steps are a gas absorption step and a subsequent regeneration of the absorbant.
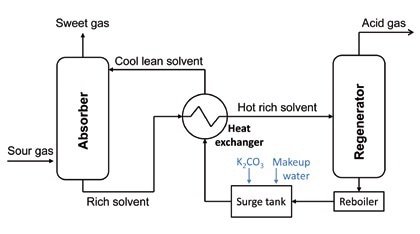
Figure 1. Basic Benfield process – schematic
Benfield Process
The gas compounds that need to be removed from industrial gases react with the potassium carbonate in the absorption solvent:
K2CO3 + CO2 + H2O → 2HCO3- + 2K+
K2CO3 + H2S + H2O → HCO3- + HS- + 2K+
In the regenerator, the spent solvent is completely stripped of the absorbed CO2 and H2S. The regenerated solvent is recycled back to the absorber after energy recovery takes place using heat exchangers. Vanadium is added to the absorption solvent for prevention of corrosion, and accumulation of side stream solids takes place. These contain the absorbed elements, which, in the instance of natural gas treatment, can be heavy metals such as mercury.
A key analytical challenge for natural gas production is that most analytical sites and facilities are remotely located, making the supply of cooling water and technical gases challenging. The key demand on analytics in industrial environments is that measurement results must be obtained rapidly. Thus, it is good if preparation and analysis of the sample is done in close proximity to the production site.
The key tasks of the Benfield process are controlling potassium concentration as the key factor for the solution’s absorption potential, and determining vanadium for prevention of corrosion. Further, the analysis of the side stream solids is required with specific attention to toxic metals. General analytical challenges are high matrix concentrations of the solvents and the variable element distributions of the side stream solids.
Sample Preparation
Santos Ltd provided eight used or fresh potassium carbonate solutions and one side stream solid sample from the Moomba gas field in Central Australia.
10 ml of double-distilled water was added to 1 ml aliquots of Benfield solutions. For internal standardization, 100 µl of a scandium solution (1 g/l) was added. After complete homogenization, pipetting of 10 µl sample solution was performed onto a quartz glass sample carrier and then dried on a hot plate at 60 °C. Careful grinding of the dry stream solid sample was performed in an agate mortar for 2 minutes. 100 mg of ground material was weighed into a centrifugation tube and then suspended in 5 ml of an aqueous Triton X-100 solution (1 Vol.-%).
For internal standardization, 10 µl of a gallium solution (1 g/l) was added. After the homogenization is complete, the centrifugation tube is arranged in an automatic sample shaker 10 µl of the sample suspension was transferred to silconized quartz glass sample carriers, while the samples were shaken at ~800 r/min.
Samples were prepared seven times in order to determine the analytical reproducibility. The S2 PICOFOX spectrometer was used for measuring the samples. It had a 300 mm2 XFlash®silicon drift detector and a Mo microfocus tube. The tube was set at 50 kV/600 µA. The measurement time was 180 and 1000s for the Benfield solutions and the side stream solid respectively. The TXRF results and the wet chemistry data provided for potassium carbonate and vanadium by Santos Ltd were compared. Comparison was also performed with ICP-OES measurements obtained from an external service laboratory.
Results
Tables 1 and 2 show the results for the side stream solid and the Benfield process solutions respectively.
Table 1. TXRF measurement results for the side stream solid sample (s = standard deviation of a sevenfold measurement, LLD = lower limit of detection).
| Element |
Conc. [mg/kg] |
s [mg/kg] |
LLD [mg/kg] |
| P |
405 |
63 |
94 |
| S |
63534 |
2594 |
55 |
| K |
40623 |
1179 |
14 |
| Ti |
35 |
7.7 |
4.4 |
| V |
8402 |
226 |
3.3 |
| Cr |
1637 |
63 |
3.2 |
| Mn |
471 |
13 |
3.0 |
| Fe |
129913 |
4716 |
3.0 |
| Ni |
516 |
20 |
0.82 |
| Cu |
175 |
8.3 |
0.71 |
| Hg |
16295 |
749 |
0.93 |
Table 2. Measurement results derived from TXRF, wet chemistry and ICP-OES analysis for potassium, vanadium and sulfur in Benfield process solutions (s = standard deviation of a sevenfold measurement).
| Sample |
K [mg/l] |
K2CO3 [wt%] |
V [mg/l] |
V [wt%] |
S [mg/l] |
| TXRF |
ICP-OES |
Wet chemistry |
TXRF |
ICP-OES |
Wet chemistry |
TXRF |
| Average |
s |
Average |
Average |
Average |
s |
Average |
Average |
Average |
s |
| 513888 |
26076 |
5836 |
24000 |
53.3 |
782 |
100 |
760 |
1.000 |
< LLD |
- |
| 513889 |
28191 |
4098 |
27000 |
54.1 |
898 |
55 |
810 |
0.919 |
< LLD |
- |
| 598101 |
19082 |
1719 |
15000 |
15.1 |
470 |
25 |
510 |
0.619 |
2806 |
365 |
| 598104 |
18457 |
1639 |
16000 |
18.0 |
470 |
25 |
470 |
0.611 |
2115 |
185 |
| 598105 |
23274 |
1803 |
16000 |
38.5 |
535 |
54 |
520 |
- |
89 |
15 |
| 598106 |
14739 |
679 |
13000 |
20.0 |
360 |
18 |
420 |
- |
1764 |
69 |
| 598107 |
15917 |
970 |
12000 |
19.1 |
340 |
45 |
420 |
- |
1897 |
64 |
| 598108 |
18799 |
1017 |
15000 |
15.8 |
429 |
32 |
490 |
0.587 |
2631 |
197 |
Figure 2 shows a comparison between the potassium concentrations obtained from TXRF and external ICP-OES measurements, and the potassium carbonate values determined by wet chemistry.
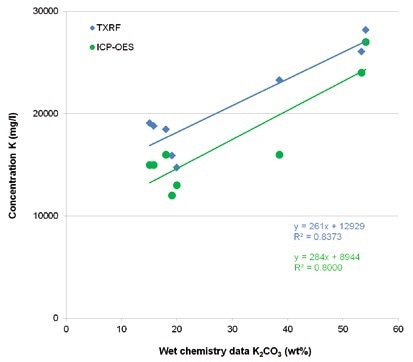
Figure 2. Comparison of TXRF and ICP-OES values for potassium with wet chemis-try data for potassium carbonate in Benfield process solutions.
While there are systematic deviations of the absolute amounts, for both methods, a linear correlation with the K2CO3 values is seen. This is mostly due to a different analytical and sampling approach. Figure 3 shows that the TXRF and the ICP_OES results are in agreement.
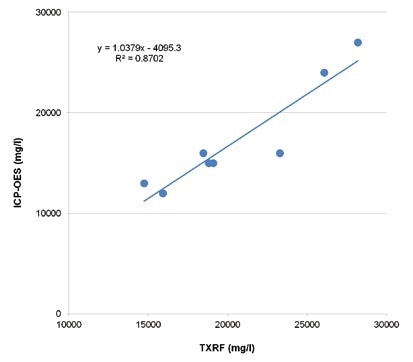
Figure 3. Comparison of TXRF and ICP-OES values for potassium in Benfield pro-cess solutions.
Figure 4 shows that for the vanadium concentrations measured, the wet chemistry data on one side and TXRF and ICP-OES values on the other side correspond very well.
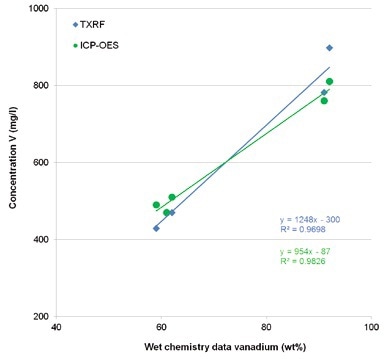
Figure 4. Comparison of TXRF and ICP-OES values for vanadium with wet chemistry data for vanadium in Benfield process solutions.
This is also confirmed while comparing TXRF and ICP- OES values for vanadium (Figure 5).
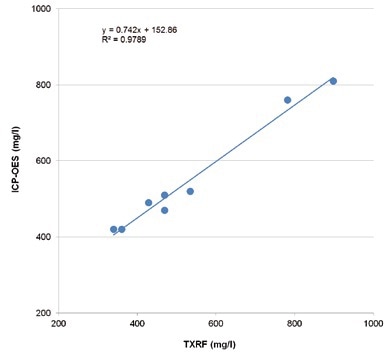
Figure 5. TXRF and ICP-OES values for vanadium in Benfield process solutions
From other measurement methods, there are no comparative values for sulphur. It can, however, still be stated that the simultaneous analysis of the element using TXRF is possible with very good repeatability. Further to the Benfield process, elements that have been mentioned here as having high amounts of mercury and iron and traces of chromium, titanium, nickel, manganese and copper were identified in the side stream solid sample.
Conclusion
TXRF has proved to be the right analytical tool for rapid analysis of vanadium, potassium and sulfur in Benfield process solutions. The sample preparation is simple with a dilution step, a mono-element solution for internal standardization and drying a small aliquot on a sample carrier.
The direct preparation procedure, along with a low demand for a laboratory infrastructure, shows that TXRF is an ideal analytical technology for operating in remote locations or a small laboratory. Also, complex samples such as side stream solids can be studied by TXRF with least operation expense and sample preparation.

This information has been sourced, reviewed and adapted from materials provided by Bruker Nano Analytics.
For more information on this source, please visit Bruker Nano Analytics.