The pharmaceutical processing industry coats tablets for different kinds of reasons. Tablets can be coated to improve the taste, appearance, swallowability, chemical stability and also to formulate a specific release profile for active pharmaceutical ingredients (APIs). The pharmaceutical industry often uses an active coating method to achieve this.
In this method the tablet’s coating can also contain the API to ensure that a multi-step release profile is produced for one API. It also is possible to have two APIs, with one API on the coating and the other in the core to ensure that two chemically mismatched APIs are isolated in their delivery.
However this process poses a major problem to the pharmaceutical’s coating unit operation. The coating application must be accurate to ensure that the active ingredient included in the tablet’s coating is not at too low or too high a concentration.
As a result, it is critical to track this process to ensure an accurate endpoint of the coating unit operation. This process monitoring is complex because the endpoint has to be determined quantitatively, accurately and non-disruptively. In this article Raman spectroscopy with Kaiser Optical Systems’ noncontact large-spot PhAT technology is used to perform this task.
Experimental Procedure
A pharmaceutical pan coater was used to simulate an active-coating process. Diprophylline was taken as a model drug which was coated on placebo tablets as well as on tablets with diprophylline as the API. During the course of this procedure, an analyzer using Kaiser’s PhAT technology was used to acquire in-line Raman data. Using a PhAT probe head, the 785 nm laser was directed towards a 6 mm circular large-spot area located 22 cm away.
Kaiser’s software packages were used for automatic data collection. For each individual spectrum, the collection time took less than 30 seconds. With the aid of a PLS model the spectral information was matched with the amount of the imparted active ingredient and the tablets’ weight gain. In order to establish the distance of the non-contact probe-head optic from the tablet and the influence of pan rotation speed further experiments were carried out.
Results
Two peaks were observed at 1290 and 1330 cm–1 and found to correspond with the diprophylline coating on the tablets. They can be used to track the progress of the coating procedure, as shown in Figure 1.
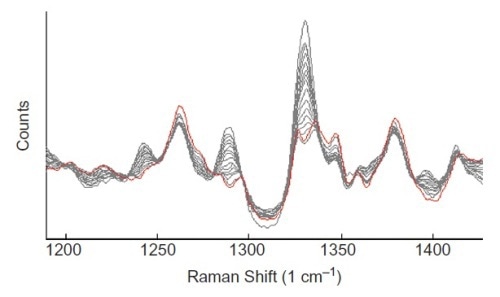
Figure 1. Baseline-corrected Raman spectra of tablets at different stages of coating. The peaks at 1290 and 1330 cm-1 are assigned to the diprophylline API.
PLS modeling was usedto associate the differences in the Raman spectra with the differences in the coating amount. In Figure 2, the close association between the measured and estimated outcomes for the two trials via the four process stages can be seen. These process stages include warm-up, coating, drying and cooling.
With the help of a Raman spectroscopic method the quantity of diprophylline added to the coating was found to be within a fraction of a milligram. Thus, this technique enables accurate measurement of the amount of drug added to a tablet coating.
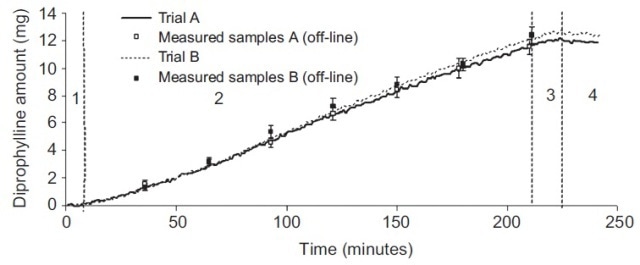
Figure 2. Prediction and results of diprophylline amount in tablet coating in in-line trials. Numbered process stages: (1) warm-up, (2) coating, (3) drying, (4) cooling. The predicted amount of diprophylline added in the active coating corresponded very closely to the measured amount.
With respect to the working distance of the probe head optic from the tablets and the pan coater’s rotation speed the in-line Raman technique was deemed to be robust and remained unaffected by these changes.
While the Raman intensity of the peak at 1330 cm–1 was affected by variations in the rotational speed from 0 to 18 rpm (Figure 3), these variations did not radically affect the application’s quantitative performance. This robustness of the Raman technique can be attributed to the analyzer’s capability to sense critical wavelengths and Kaiser’s PhAT technology sampling.
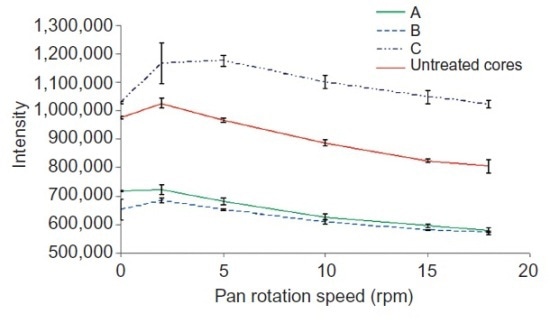
Figure 3. Variation of Raman intensity of the 1330-cm-1 peak with the rotation speed of the pan coater. Trials are labeled A, B, and C. Reprinted with permission from Ref. 1. © 2010 Informa Healthcare
With respect to the sample the in-line Raman spectroscopic technique is robust to changes in the working distance of the non-contact optic. This robustness is more critical in industrial processes where the product that needs to be studied moves continuously and the distance between the sampling probe and the product differs considerably. The API’s Raman signal was intense at different working distances, as shown in Figure 4.
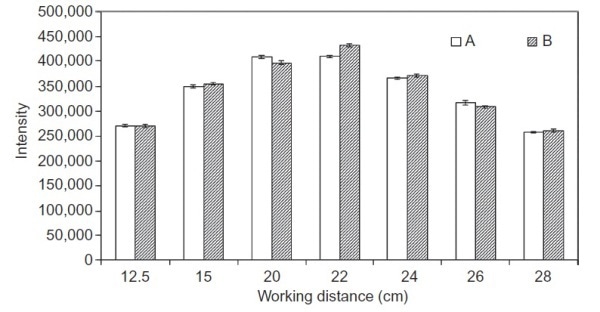
Figure 4. Variation of Raman intensity of the 1330-cm-1 peak with working distance of the non-contact, largespot probe optic over two trials, A and B.
Conclusion
This article has demonstrated how Kaiser’s PhAT technology sampling proves useful for Raman-based process evaluation of tablets in the pharmaceutical industry. In-line Raman spectroscopic method can be effectively used to establish the endpoints of active-coating processes both precisely and quantitatively. If appropriately implemented the Raman technique can be employed for accurate in-line quantitative testing of coating processes without any major effect from the movement of samples.

This information has been sourced, reviewed and adapted from materials provided by Kaiser Optical Systems, Inc..
For more information on this source, please visit Kaiser Optical Systems, Inc..