The ferrography technique was developed in the 1970s to overcome the large particle detection deficiencies of spectrometric oil analysis. The technique is used to separate particles from fluids for microscopic examination and subsequent analysis. The term ferrography derives from the initial development of the methods to precipitate ferrous wear particles from an engine lubricating oil.
A strong magnetic field gradient was used in the original analytical ferrograph to separate wear particles from the used oil sample for subsequent microscope examination.
Since then, numerous instruments have been introduced, including the rotary particle depositor that also separates wear particles for microscopic examination with other instruments that quantify the amount of ferrous wear debris in an oil sample. The analytical ferrograph, used to prepare a ferrogram, is the primary instrument in ferrography.
One surface of a microscope slide is painted with a non-wetting barrier, which traps the fluid delivered by a peristaltic pump. In use, the slide is mounted at a slight horizontal angle, which enables the fluid to flow by gravity along the glass but within the barrier, where it is finally picked up by a drain tube.
The slide is mounted above two permanent magnets that are separated by an aluminum sheet. The poles of magnets are counter posed - one magnet pole is considered north and the pole of the other magnet across the aluminum strip is south. When the magnets are positioned this way, it creates a strong magnetic field gradient in the vertical direction above the aluminum strip.
A strong downward force is experienced by magnetic particles in the fluid. These particles migrate via the fluid down to the glass surface, and get deposited in strings perpendicular to the direction of fluid flow (Figure 1).
Once all of the fluid in a given sample has run across the slide, a fixer solution is passed over the slide to remove the residual fluid. When the fixer has evaporated, the slide is ready for observation with a microscope. Ferrous particles are deposited on the slide based on size.
The force acting on a particle is proportional to volume, but the viscous resistance of the suspending fluid is proportional to surface area. Therefore, for spheres force increases with the cube of the diameter (volume) and resistance increases only with the square of the diameter (contact surface) [1].
Therefore, the largest ferrous particles are deposited at the entry area of the slide where the lubricating oil first touches down on the glass surface. All ferrous particles larger than a characteristic size will have been precipitated, at a position farther along the slide.
For non-ferrous particles, such as brass, white metal, aluminum etc., precipitation will often occur as these materials are weakly magnetic. However, the deposition of these materials will be less size-selective. As a result, large particles of nonferrous metal can be found anywhere along the length of the slide, as can be seen in Figure 1.
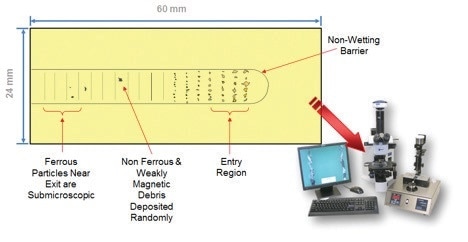
Figure 1. Example of a Ferrogram. On the lower right is an image of the Spectro Scientific Thistle Tube Ferrography Lab including ferrography slide maker, microscope and wear particle atlas (WPA) software with reference pictures.
When the slide is examined in a bichromatic microscope, details of shape, size, and number of particles are revealed. The condition of oil-lubricated parts may be assessed from this information [2].
Usually, machines that operate normally generate small flat particles at a slow steady rate. If the number of particles increases, and particularly if the ratio of large to small particles increases, it indicates that a more severe mode of wear has begun. The generation of large severe wear particles indicates the imminent failure of the wearing surface.
Different wear mechanisms each generate characteristic particles. Six regimes of wear have been found with sliding wear. Miscellaneous-shaped particles are generally a sign of break-in wear and small platelets are linked to normal rubbing wear. The metallic rubbing wear particles increase in size and become oxidized, as operating parameters become more arduous. Finally, large, metallic, severe wear particles are produced just before the machine fails.
Similar to a crude machining process, abrasive wear generates particles in the form of spirals, loops, and bent wires. An increase in the size and number of these particles indicates that an abrasive wear mechanism is progressing quickly.
Additionally, two types of particles – laminar particles and fatigue chunks – are associated with rolling mechanisms. Fatigue chunks are materials removed as rolling elements spall, laminar particles, which are thin, huge plates, are formed as a result of material being passed through the rolling contact.
When rolling and sliding are combined, like in gears, fatigue chunks and scuffing particles are produced. Their origin can be established by determining the composition of the particles. The reflectivity, color of particles, and the site of deposition can help in their identification. Examples of abrasive wear, sliding wear, and fatigue wear are shown in Figure 2.
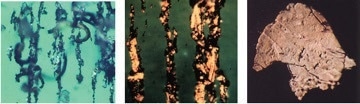
Figure 2. Example of cutting wear, severe sliding wear and fatigue wear
Ferrography can be useful to detect situations that are not obvious, such as water in oil as described below:
Used oil samples were collected from a 1200 kW, turbine-driven reduction gearbox that had just been overhauled. After five days of operation, a wear particle baseline was established. At that time, the ferrograms did not identify any crystalline particles or severe oxides. A certain number of dark metal oxides found at the entry deposit were the only reservation of the analyst.
However, the oil sample taken after a month of operation reflected a highly deteriorated wear situation. Many red oxides and free metal particles with oxidized and tortured surfaces were also found. Water in the lubricant caused an oxidative attack and also reduced the load carrying ability of the lubricant, resulting in large, abnormal wear particles. Oil-water separators were installed in the lubricating system as a result of the tests, and follow-up sample analysis returned to normal.
Conclusion
Oil analysis laboratories use ferrography techniques regularly. Ferrography offers comprehensive information about machine wear, but is quite complicated and needs a specially trained technician to conduct the test. Wear debris analysis (WDA) is more commonly used in industrial plants as samples can be prepared more easily.
Oil is passed through a filter media and the filter is subsequently examined under a microscope. Shape, size, and morphology on large particles are carefully examined and compared with reference pictures in the library. It is a good entry level wear debris analysis option, which is offered as part of Spectro Scientific’s MiniLab Series Analyzer.
References
1. Anderson, D. P.: Analysis of Gear Wear through Ferrography, Equipment Management. (July 183), 51-56.
2. Bowen, E. R.; Westcott, V. C.: Wear Particle Atlas, Prepared for Naval Air Engineering Center, Lakehurst, New Jersey under contract N. N00156-74-C01682, (July 1976).

This information has been sourced, reviewed and adapted from materials provided by AMETEK Spectro Scientific.
For more information on this source, please visit AMETEK Spectro Scientific.