Sponsored by HORIBAJun 12 2018
The Excitation Emission Matrix (EEM) is a specific measurement that is becoming more and more respected and widely used within the field of fluorescence spectroscopy. An EEM is essentially a three dimensional scan that results in a contour plot of excitation wavelength vs. emission wavelength vs. fluorescence intensity.
EEMs have a variety of practical uses and these are of particular benefit where there is a need for multi-component analysis. These are often referred to as providing a molecular fingerprint for a diverse range of samples.
Early published uses of EEM spectroscopy were in the 1980s. EEM was used by Koller in 1986 to study tryptophan fluorescence within low density lipoproteins found within human blood serums; as well as by Leiner in the same year, who used this to look at fluorescent components in human plasma from tumor patients. EEM is much more powerful than traditional scanning fluorometers as these traditional fluorometers are limited in three key ways.
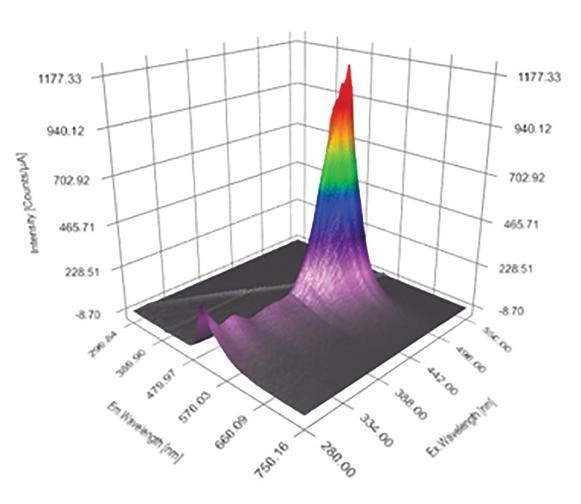
Figure 1. A typical Excitation Emission Matrix (EEM)
Firstly, traditional scanning spectrofluorometers are unable to compensate for varying concentrations of fluorescing molecules.
This phenomenon is known as the Inner Filter Effect (IFE), and it causes problems for traditional scanning spectrofluorometers by distorting the measured fluorescence spectrum of a molecule due to absorption that occurs at higher concentrations of the sample. This typically occurs above 0.1 to 0.2 absorbance units.
It is possible to correct for IFE with a traditional fluorometer, but this requires the acquisition of a secondary measurement on a separate, different absorbance spectrometer then adjusting the measured fluorescence signal as required.
As well as creating additional workload, this correction technique can prove problematic as the measure does not occur at the same time and with the same exact volumes. Because of this, traditional scanning fluorometers cannot provide true concentration independence, thus seriously limiting the ability of a traditional EEM to accurately identify a multitude of samples.
Secondly, because fluorometers measure fluorescence by definition, they are lacking vital color and absorbance information for all non-fluorescent molecules. This information could be an essential part of any multi-component molecular identification.
Finally, single channel scanning instruments are incredibly slow and may require several minutes or even up to an hour to collect a complete set of data. Scanning fluorometers are limited to how much EEM data they can actually collect in a day and are therefore restricted to working with samples that will not change or decay during the EEM’s acquisition time.
Without the additional implementation of IFE correction, the accuracy of EEM fluorescence is limited to samples that have concentrations only at absorbance values of less than around 0.1 to 0.2. In order to fully access the power and potential of fluorescence EEMs, multivariate software methods must be used. These include the Classical Least Squared method (CLS), Principal Component Analysis (PCA) and Parallel Factor Analysis (PARAFAC).
What Is the Inner-Filter Effect?
The Inner Filter Effect is made up of two distinct processes. The first is the Primary Filter Effect (PIF), and this is where the excitation light intensity is gradually diminished due to absorption, as a function of the optical path length of the liquid sample, before reaching the fluorescent volume.
The second is the Secondary Filter Effect (SIF) which is where the emitted fluorescence intensity is diminished due to reabsorption by the parts of the sample that are not directly excited by the excitation beam.
Spectral Consequence of the Inner Filter Effect
EEMs are increasingly utilized for quality analysis of water, particularly for the study of Chromophoric Dissolved Organic Matter (CDOM). This dissolved organic matter can include humic acids, amino acids, fulvic acids and other examples of decayed matter in natural water sources. It can also include the disinfection by-products of water treatment processes.
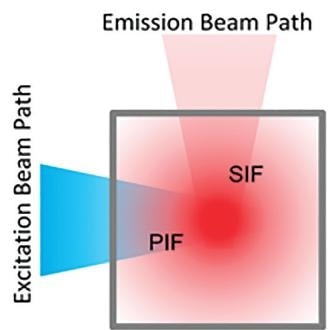
Figure 2. Blue excitation light intensity is gradually diminished due to sample absorption outside the measurement volume. Red emission light is diminished due to reabsorption of emitted fluorescent light.
Here, EEMs are used to highlight the presence of each of these at very low concentrations, generally in the ppb range. Instruments used for this purpose will ideally measure both absorbance and fluorescence spectra simultaneously.
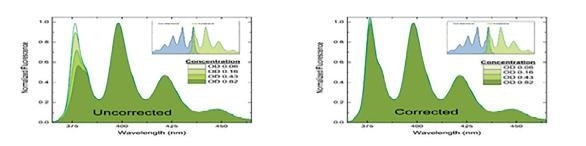
Figure 3. Spectral consequence of the inner filter effect. The shorter wavelength intensities of the fluorescence spectrum are diminished due to reabsorption of fluorescence. Fluorescence spectra of increasing optical density samples are without IFE correction on the left and with IFE correction on the right.
Fluorescence is linear with concentration only at absorbance values less than approximately 0.1 to 0.2. Because of this, higher absorbance samples must use the measurement and application of the UV-visible absorbance spectrum in order to ensure that corrections to the fluorescence intensity for inner-filter effects are made.

This information has been sourced, reviewed and adapted from materials provided by HORIBA.
For more information on this source, please visit HORIBA.