Sponsored by HORIBAJun 12 2018
For many years already, lithium-ion batteries have been used in a variety of applications due to their rechargeability and relatively better ease of use in comparison to lithium batteries. Li-ion batteries are widely-used in many portable and electronic devices, cordless tools, and even electric cars. While the need to power multiple devices continues to grow with complexity, the performance of Li-ion batteries has started to become an issue.
The operational quality of lithium-ion batteries is heavily influenced by the state of the cathode and the anode. During charging and discharging processes, lithium ions travel from one electrode to another, with the electrolyte acting as its connective mechanism. This process induces structural changes within both the cathode and the anode. While these changes are generally and ideally reversible, charging or discharging processes, in some cases, could provoke irreversible cases in the materials.
Raman spectroscopy provides a solution regarding structural changes in the cathode and anode. Being a contactless and fast device, the spectroscopy does not influence samples and allows real-time analysis of batteries during the charge-discharge cycle. With its easy-to-use and information-rich mechanism, Raman spectroscopy is an excellent tool in several analysis levels, from various research and development endeavors to automatic quality control measures.
Cathode Analysis
A layered lithium cobalt oxide LiCoO2 (LCO) is the commonly-used material for cathodes. Lithium-ions are de-intercalated or intercalated into the layered cobalt-oxygen octahedral structure during the charge and discharge process of batteries. Over-discharge will irreversibly decompose the oxide into lithium oxide (Li2O) and cobalt oxide (CoO), ultimately converting them into LiCoO2 and CoO2. As shown in the figure below, these changes could be observed using Raman spectroscopy. The Raman map recorded on the cathode after the charge-discharge process would show a presence of cobalt dioxide.
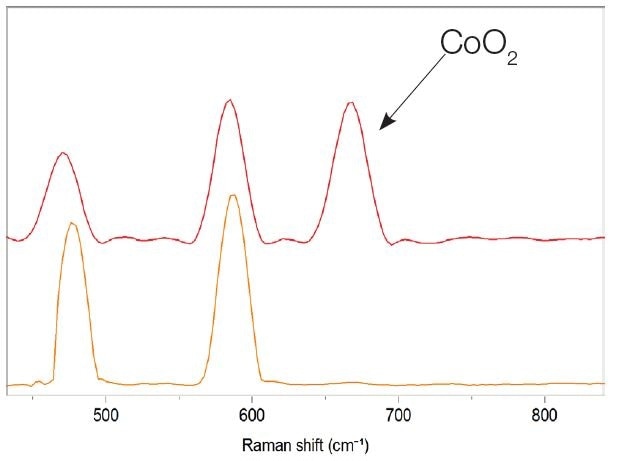
Spectral difference between LiCoO2, and LiCoO2 with a presence of cobal oxide CoO2.

Raman image LiCoO2 cathode after a cycling process, the presence of CoO2 was detected: blue color corresponds to the presence of amorphous carbon, orange spots shows the distribution of LiCoO2, and red spots corresponds to different concentrations of CoO2.
Different types of lithium-transition metal mixed oxides, such as Li(Ni, Mn, Co)O2, LiMn2O4, Li2TioO3 are currently being investigated as potential cathode materials. Raman spectroscopy could bring in new information about the applicability and potential structural or chemical changes of such materials.

Raman spectra of cathode materials: LiCoO2, Li(Ni,Mn,Co)O2, LiMn2O4 and Li2TiO3.
Anode Analysis
Graphite is a common material for anode; however, among cathode layer materials, graphite may deteriorate after the charging-discharging process. The ID/IG ratio of bands D and G of Raman spectrum is related to damages in the structure. The increasing intensity of D band in relation to the intensity of the G band would indicate graphite degradation. Raman imaging could clearly show these changes occurring in the graphite structure.

Raman spectra of graphite with different ID/IG ratio.

Raman image graphite anode after a cycling process: blue zones show graphite with a relatively low level of defects; and dark blue show graphite with higher level of defects; and orange zones correspond to presence of a binder (resin).
Conclusions and Perspectives
With the current course of technological advances requiring reliable, efficient, and powerful energy sources, lithium-ion batteries are eyed as potential realizations of such endeavor. Raman spectroscopy adapts to the various stages of performance of lithium-ion batteries, in such a way that new material characterization for more flexible systems or failure analyses could be developed. More importantly, Raman spectroscopy enables a more standard material analysis during the charge-discharge process, including structural and electronic properties as well as automated quality control tests.
Sources and Further Reading
- R. Baddour-Hadjean and J.-P. Pereira-Ramos (2010). Chem. Rev., 110, 1278–1319.
- V. A. Sethuraman, L. J. Hardwick, V. Srinivasan, R. Kostecki. (2010). Journal of Power Sources, 195, 3655–3660.
- R. Kostecki, J. Lei, F. McLarnon, J. Shim, K. Striebel. (2006). J. Electrochem. Soc., 153, A669-A672.
- R. Kostecki, X. Zhang, P.N. Ross Jr., F. Kong, S. Sloop, J.B. Kerr, K. Striebel, E. Cairns, F. McLarnon, F., report LBNL-48359, DOI:10.2172/861953 *Paul Scherrer Institute, http://www.psi.ch/lec/electrochemical-energy-storage
- Berkley Energy Storage & Conversion for Transportation and Re- newables Program, https://www.lbl.gov/research/energy-storage/

This information has been sourced, reviewed and adapted from materials provided by HORIBA.
For more information on this source, please visit HORIBA.