Sponsored by AdmesyAug 10 2018
Lighting and display manufacturers must ensure their products are consistent in their light output, making them reliant on effective quality control methods. Their products must be validated, and their output measured, in different environments to ensure they will operate as required.
One such measurement technique is spectroradiometry, which provides this ability and allows the characterization of light sources with a wide set of parameters. This enables standards to be established, which in turn sets the blue-print for more consistent lighting.
The spectroradiometer can carry out both radiometric measurements, which measure light objectively, and photometric measurements, which are concerned with how humans perceive light.
The Spectrometer
A spectrometer is a device that measures and records light waves over a specific area of the electromagnetic spectrum. It works by taking in light, splitting it into its spectral components and digitizing the signal as a function of wavelength. The resultant data run through software for processing and analysis.
The light enters the spectrometer from the external light source through optics such as a lens, cosine corrector or via a fiber optic connected to an integrating sphere. It then passes through a narrow entrance slit into the instruments internal chamber.
The slit allows fine control of the amount of light entering the spectrometer. The divergent light is then collimated by a concave mirror and focused onto a grating, which disperses the spectral components of the light at slightly varying angles. This splits the light according to wavelength, and the fragmented light is then focused by a second concave mirror onto the detector.
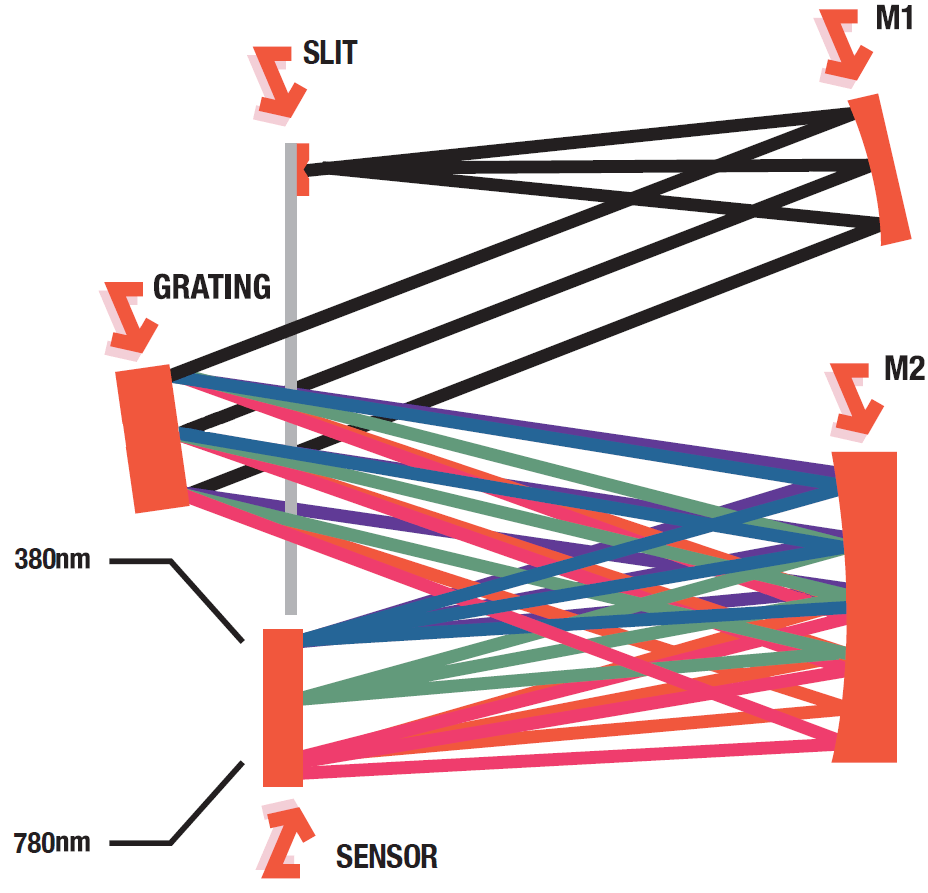
Image Credit: Admesy
In some cutting-edge miniature spectrometers, the incident light is processed by a concave holographic grating instead of mirrors and grating. The spectral image on the detector is then converted into a digital signal, which is processed and analyzed to provide a spectrum and other characteristic measurements.
What can the Spectrometer Measure?
The basic function of a spectrometer is to measure intensity as a function of wavelength. However, the data procured contains more information than just the spectral power distribution. A whole range of parameters can be measured including the absolute calibrated irradiance of radiant sources such as incandescent lights, LEDs, gas-discharge lamps and flat panel displays.
There are also additional parameters such as color rendering capabilities (CRI), photosynthetically active radiation (PAR), color coordinates (XYZ, Yxy, Yu’v’), peak wavelength, dominant wavelength etc.
In a practical example we can consider lighting products that have several important parameters that can be quantified by the spectrometer. A crucial factor in lighting is color consistency or color difference and the spectrometer provides a well-defined method of comparing emissive colors of each of the components, for example when measuring RGB LEDs.
Along with this, spectrometers can keep track of dominant wavelengths and calculate color temperatures to regulate and document lighting products. One example that is important for anyone that uses an electronic display is the monitoring of high energy blue wavelengths.
Prolonged human exposure to this light that is present in display and lighting devices can damage eyesight (blue light hazard). These are just a couple of the uses the spectrometer can be put to, which show that it must be flexible and allow a range of measurements and modes of operation; an example of this type of spectrometer is the Rhea from Admesy.
The Rhea - The Key Components of a Spectrometer
For configuring measurements in the range of 200 and 1100 nm Admesy now offers their flexible spectroradiometer platform, the Rhea. With various choices in slit size, gratings and sensors it enables total flexibility towards the optical application.
The Rhea can also be customized with a number of optional add-ons such as collimating lenses, cosine correctors and fiber connectors in order to connect to integrating spheres. For very high sensitivity measurements it the instrument also has a cooled (-10 °C) high-end CCD detector.
The Filters
To cover as large a dynamic range as possible the Rhea incorporates a filter wheel with four neutral density (ND) filters of varying optical densities (OD1, OD1.3, OD2 and OD3) which allows the instrument to operate at low luminance up to very high brightness levels. The fully open and closed configurations are occupied by the fifth and sixth position on the filter wheel (OD0 and shutter function respectively).
Neutral Density (ND) filters are specifically designed to reduce transmission uniformly across a section of a specific spectra and are typically defined by their Optical Density (OD), which is a measure of how much energy is blocked by the filter. A high optical density value indicates low transmission, and a low optical density indicates high transmission. Each ND filter is fully calibrated so no spectral difference is visible between ND filter wheel positions.
The Slit
The slit allows light to enter the spectrometer, with the width of each slit affecting the resolution; the narrower the slit, the higher the optical resolution. There is a downside as with a reduced slit width the signal strength decreases, which requires longer integration times.
The most common slit widths used in spectrometers are 10, 25, 50, 100 and 200 μm. The height and width of the slit also must fit the diameter of the fiber optic cable that channels light into the spectrometer. This restricts the use of some slits depending on the design of the optical bench.
The Concave Mirror
The Concave mirror reflects the beams of light, altering their path to make them as close to parallel as possible before they reach the diffraction grating. Collimators have the effect of improving resolution but at the same time they reduce intensity. The optical bench of the Rhea with Czerny-Turner configuration has two concave mirrors, the second of which is used to focus light of similar wavelengths onto the same pixel of the CCD sensor.
The Diffraction Grating
At the core of the optical spectrometer is the diffraction grating. This component splits the incoming radiation and then disperses each of the individual spectral elements by wavelength, projecting them onto a detector via the second concave mirror.
The wavelength range and, in part, the optical resolution that the spectrometer can achieve is determined by the grating. There are two different types of diffraction gratings: ruled gratings and holographic gratings, with the level of dispersion down to the number of lines or grooves. Ruled gratings are simple and inexpensive to manufacture, however, the flawed surfaces exhibit more stray light. Holographic gratings are used to minimize this problem in high-end spectrometers.
The Rhea has several gratings, each with a certain number of grooves per millimeter. This groove-density has an influence on the optical resolution of the spectrometer: the more grooves, the wider the light is dispersed. As there are width constraints on the detector and design of the optical bench, a wider dispersion also means a smaller wavelength range.
As well as taking groove density into account, another important parameter in configuring a spectrometer is the blaze wavelength of the grating. The blaze wavelength is expressed as a nanometer wavelength value and represents the gratings response as a function of wavelength. This can result in the same amount of grooves per millimeter leading to different optimized wavelength ranges, based on its blaze wavelength.
The Detector - A Charge Coupled Device (CCD)
The CCD is the detector used to pick up the resulting wavelengths following splitting. The CCD consists of millions of individual detector elements in a silicon-based multichannel array (pixels) which can detect UV, visible and near-infra light.
When exposed to light each pixel begins to accumulate a charge. This increases as when a photon strikes the pixel and an electron is released, these collisions add up and a charge build-up occurs. The brighter the light (i.e. the more photons) or the longer the interaction and the greater the charge that develops. The charge between cells is ‘coupled’ which amplifies the analogue signal, producing a highly sensitive spectrometer.
Once the measurement period ends (integration time), the charge of each of the elements is read by the read out electronics, at which point each individual charge reading is measured. CCDs are widely used for optical spectroscopy as they provide the greatest sensitivity, uniformity and noise characteristics for particular wavelength ranges. It is usual for some degree of cooling to be necessary to make CCDs suitable for high grade spectroscopy which lowers the amount of noise.
This is particularly interesting for applications that deal with very low luminance levels and still require accurate measurement data. Cooling is typically done using either Peltier cooling or cryogenic liquid nitrogen.
References & Further Reading
- Crouch, Stanley; Skoog, Douglas A. (2007). Principles of instrumental analysis. Australia: Thomson Brooks/Cole. ISBN 0-495-01201-7.
- Kalyani Chaganti, Ildar Salakhutdinov, Ivan Avrutsky, and Gregory W. Auner, "A simple miniature optical spectrometer with a planar waveguide grating coupler in combination with a plano-convex lens," Opt. Express 14, 4064-4072 (2006)
- Ade Yeti Nuryantini, Ea Cahya Septia Mahen, Asti Sawitri and Bebeh Wahid Nuryadin, Do it yourself: optical spectrometer for physics undergraduate instruction in nanomaterial characterization, European Journal of Physics, Volume 38, Number 5, 16 August 2017
- Tipler, Paul (1992). Elementary Modern Physics. MacMillan. p. 149. ISBN 9780879015695.

This information has been sourced, reviewed and adapted from materials provided by Admesy.
For more information on this source, please visit Admesy.