Water concentration is perhaps the most common measurement made in the near-infrared (NIR). Water analysis is important as the presence of water can have a significant impact on the properties of a product, or on the reactivity of a reagent.
In terms of practicality water is very easy to detect and analyze because it absorbs in the NIR region very strongly when compared to organic molecules.
Due to the strength of its absorption and its molecular simplicity it is possible to measure water content using a single wavelength, meaning a photometer (rather than a spectrometer) can be used for its analysis.
This article will cover choosing the right photometer, with the correct wavelengths and fiber optic probe with a suitable path length for the analysis.
Factors to Consider
- The concentration range of water and the level of measurement precision required
- The background noise generated by organic compounds present
- Possible false positives from the presence of hydroxyl-containing compounds
- The clarity of the sample
- Variations in the temperature of the sample
All of these factors impact how sophisticated the photometer and probe need to be. This degree of sophistication may impact the cost-effectiveness of the analysis.
Analytical Goals
- Achieve the best possible sensitivity
- Choose wavelengths which hold the absorbance under 1.2 AU
- Have an optical path longer than 1 mm as this makes cleaning easier and avoids particles and bubbles being trapped
- Minimize interference from temperature changes and from organics in the sample
Rule-of-Thumb
The 1900 nm region is generally used for <1% water concentration; when using a ClearView® db photometer in this region, precision of approximately ± 20 ppm is possible.
For samples of more than 1% water concentration, measurements are usually made in the 1400 nm region with a precision of approximately ± 100 ppm.
For process analyzers, precision is best defined by long-term (monthly) photometric drift. For the ClearView db this is usually less than 500 μAU.
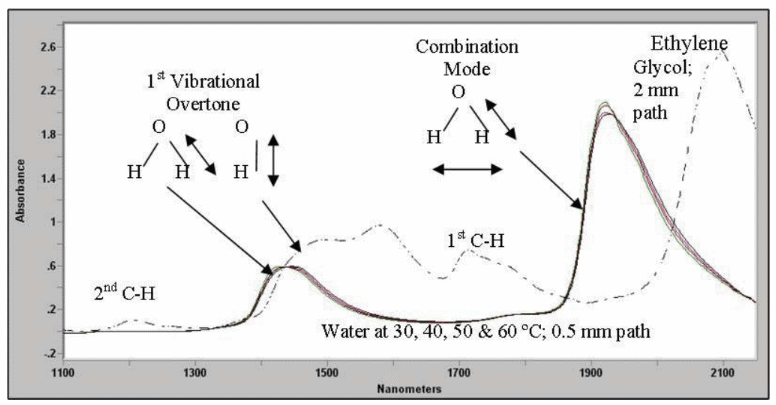
The absorbance band in the 1400 nm region is the first overtone of the O-H band due to the presence of water and hydroxyl groups. This is demonstrated in the above diagram for water and ethylene glycol. Mixtures consisting of alcohols and water have overlapping features in this region as both contain O-H bonds.
The two types (water and glycol) can be distinguished by the large peak near 2100 nm in alcohols, which is a combination of O-H and C-H bond effects, or a unique water peak at 1900 nm, which is a combination of the H-O-H bend and O-H bond effects.
It should be noted that at equivalent optical paths, water is a far stronger absorber than ethylene glycol. This is made evident by the significantly weaker absorption observed at 1900 nm for pure glycol.
Precision
Water’s absorption in the 1900 nm region is approximately five times larger than the absorption peak at 1430 nm. This means that for water in n-propanol with a 1 cm optical path an absorption of 1 mAU in the 1900 nm region corresponds to 20 ppm water, whereas in the 1430 nm region this would correspond to 90 ppm.
For water in THF (tetrahydrofuran) or MIBK (methylisobutyl ketone) these values are 85 and 12 ppm/mAU respectively.
The precision can be estimated using a conservative drift of 3 σ of 1.5 mAU and a 1 cm path length. For the ClearView db the precision is ±125 ppm at 1430 nm and ±20 ppm at 1900 nm.
Spectral Background and Path Length
The absorbance of liquid organics in the 1900 nm region varies significantly. CCl4 shows no absorbance in this region meaning long optical paths (10 – 20 cm) can be used to detect water at concentrations lower than 1 ppm.
Many alcohols show absorption in this region, e.g. ethylene glycol absorbs 1.4 AU using a 1 cm optical path. Using an optical path of 5 mm gives a baseline ethylene glycol absorption of 0.7 AU. As the absorption for water with a 5 mm pathlength is 24 ppm/mAU a water concentration of 1% would add approximately 0.4 AU to the 0.7 AY baseline giving a total absorption of 1.1 AU.
This means that having a water concentration greater than 1% results in the 1.2 AU limit being exceeded so for higher water concentrations an even smaller pathlength is required.
Sample Clarity
A photometer computes the absorbance between the water wavelength and a “reference” wavelength (= -log Water/Reference) and converts that into water concentration using a calibration. The wavelength for the reference is selected in a ‘valley’ which shows only small changes in absorbance, e.g., 1300 nm.
If any light scattering factors are present (bubbles, immiscible phases or particles) the whole spectrum can be tilted between the reference and the water wavelengths. As the water peak is being measured on a fine (mAU) scale the results can be easily tilted.
The more significant the difference in wavelength the greater the effect of tilting (e.g., at 1900 nm). To account for this it is possible to choose a reference wavelength near to 1900 nm, but it remains important to filter particles out of the sample and maintain a constant temperature.
The voltage from the detector at the reference wavelength (sent to the DCS as a 4-20 mA analog output) can be used to monitor the clarity of the sample.
Temperature Effects
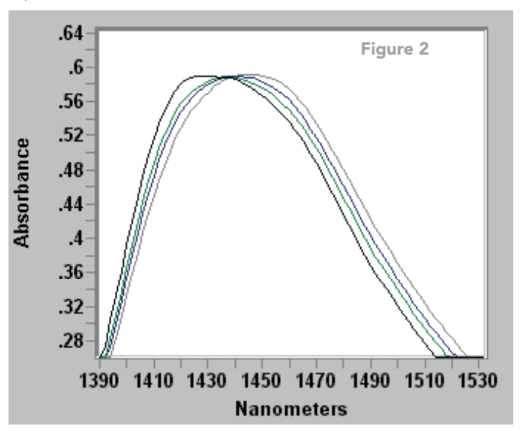
The highest point of the 1430 nm water peak is highlighted in Figure 2 in different spectra at temperatures ranging between 30 – 60 oC. This demonstrates that different calibration strategies may be required for measurements with varying temperatures.
Research of percentage water concentrations has shown that when using the 1400 nm absorption a change in temperature of 1 oC can result in the calculated water concentration changing by 0.1% (1000 ppm).
There are a variety of different ways of minimizing the impact that temperature has on the calculation. The wavelength selection may be optimized for temperature variation, or the piping in the side stream can be heat traced for calibration. A popular solution is to determine the sample temperature using a thermocouple (located near the probe) or an RTD sensor and to feed this information back to the ClearView® db photometer which can automatically compensate for changes in temperature.
Conclusion
Taking all of the factors above into consideration it is clear that Process Insights can provide an effective and economical solution for water concentration analysis over the suitable concentration range for organic solutions.

This information has been sourced, reviewed and adapted from materials provided by Process Insights – Optical Absorption Spectroscopy.
For more information on this source, please visit Process Insights – Optical Absorption Spectroscopy.