In 1991, Lithium-ion (Li-ion) batteries were commercialized. Commercialization was the beginning of the culmination of detailed R&D led by scientists and engineers from around the world, which continued for the next several decades. Even now, further developments are being continued in Li-ion batteries and alternative rechargeable batteries, which are both widely available.
The world is quickly moving into a new era of increased emphasis on green technologies. These technologies require more practical and accurate R&D to meet the growing demands for energy storage systems, particularly in the automotive industry.
Research has investigated the fundamentals of Li-ion battery technology and the relevant techniques and terminologies in Li-ion battery research.
What are Batteries?
A battery is categorized as an electrochemical device converting chemical energy into electrical energy. In general, batteries can be thought of as two central groups: primary and secondary. Primary batteries cannot be recharged due to the irreversible electrochemical reaction corresponding to them.
On the other hand, the electrochemical reaction in secondary batteries is reversible and means it is possible to recharge them. It is possible to reuse secondary batteries several times, and this characteristic makes them increasingly sustainable when compared to primary batteries.
Lead-acid batteries, nickel-cadmium, and lithium-ion batteries are battery technologies that are rechargeable. The most interesting if these are the Li-ion batteries because they offer increased amounts of energy density. Remarkably, lithium is the most electropositive but is also the metal with the lightest weight. These features make it a perfect candidate for creating a high energy density storage system.
Image Credit: Metrohm AG
Li-ion Batteries
Lithium-ion batteries consist of two insertion electrodes, an anode, and a cathode, and have an electrolyte in the middle. Lithium ions can move between the anode and cathode because the electrolyte is an ionically conductive medium.
Lithium ions can move between the anode and cathode because a nonconductive membrane electronically separates them. However, electrons are unable to pass through, avoiding a short circuit. The key components of a Li-ion battery are shown in Figure 1.
The electrode constituents are produced in a discharged state, which means that they remain inactive in air before the cell assembly. Usually, the negative electrode of a Li-ion battery is created using graphite, and when lithium is inserted to the negative electrode, it follows the reaction:
| XLi+ + Xe- + 6C → LixC6 |
(1) |
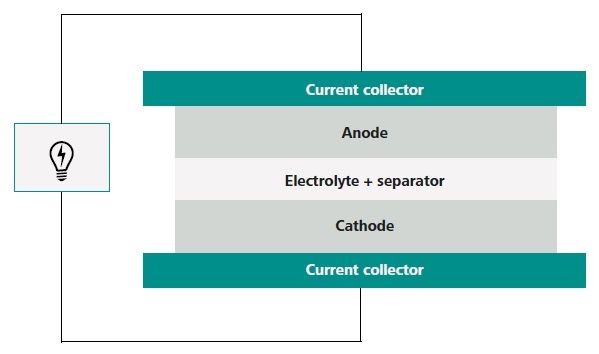
Figure 1. Schematic view of the components of a Li-ion battery. Image Credit: Metrohm AG
One lithium-ion is introduced per aromatic ring of the graphite structure, which corresponds to a theoretical capacity of 372 mAh/g. This number is equivalent to approximately 10% of the theoretical capacity of metallic lithium itself (3800 mAh/g).
An increased risk of a short circuit is seen in metallic lithium as dendrites grow upon cycling. These can penetrate through the separator and form an electrical connection between the electrodes. Replacing lithium metal with graphite leads to increased safety, enhanced stability, and higher calendar and cycle life.
One method to ensure the potential of metallic lithium anodes is to advance and utilize solid electrolytes, which are known to resist the growth of lithium dendrites. The solid electrolyte is required to have ionic conductivity analogous to the liquid electrolyte. The main difficulty in attaining these goals is to create a system that has a low resistance at the interface of the solid electrode and solid electrolyte.
Typically, the positive electrode is created using a transition metal oxide where, within the structure, Li-ions can reversibly insert themselves. During the discharge, the cathode is essentially the sink for the lithium ions when the favorable thermodynamic reaction takes place.
Amongst the positive electrodes, Lithium Cobalt Oxide, also known as LiCoO2, is the initial commercial and most common cathode technology that producers use in their Li-ion batteries. Its structure is layered and has a practical capacity of approximately 150 mAh/g. The following reaction explains the electrochemical reaction for LCO upon charge:
| LiCoO2 → Li1-xCoO2 + xLi+ + xe- |
(2) |
The electrode, either the anode or the cathode, has an active mass that is combined with an added conductive agent. The agent is typically carbon black, which is known to be highly conductive. It is a binder that sustains the whole composite as one and creates adhesion between the loaded material and the current collector.
The traditional current collector for the anode is copper, and aluminum for the cathode, which maintains inactivity at low and high potential when set against Li/Li+, respectively.
For Li-ion batteries, the usual electrolyte solutions contain LiPF6 dissolved in alkyl carbonates, inclusive of ethylene carbonate (EC) and another solvent similar to ethyl methyl carbonate (EMC). At low potential, the electrolyte is unstable, and when there is a reduction of the electrolyte on the surface of graphite, it creates an insoluble film named the solid electrolyte interphase (SEI).
The SEI was introduced in 1979 by Peled, who explained that the SEI layer is both electronically insulating and ionically conductive, and thus the reaction rates decrease in speed because of the electronically insulating property of the SEI layer. The longer lifetime of lithium-ion batteries relies on the stability of the SEI layer, and it is imperative for sustaining this.
An electrolyte additive or a mixture of electrolyte additives can be added to the electrolyte, for example, vinylene carbonate (VC) or fluoroethylene carbonate (FEC), to create a more stable SEI layer.
Although the primary responsibility of electrolyte additives is for stabilization of the SEI layer, there is potential that they could play a role in reducing the electrolyte oxidation reaction rate on the cathode surface at higher potentials.
Lithium Insertion Mechanisms
Intercalation
As previously mentioned, graphite is commonly the material used for Li-ion batteries anodes. Intercalation is the term used for the insertion mechanism of ions into the graphite structure, and it defines the insertion of Li-ions between the graphite sheets.
At room temperature, graphite can intercalate up to one Li atom per six carbon atoms, leading to a theoretical capacity of 372 mAh/g. However, the practical capacity of graphite does not exceed its theoretical capacity.
The capacity of graphite amounts to an optimal value after early charge discharge cycles of the battery, which can occur when there is a loss of active lithium due to irreversible consumption, which in turn, creates the SEI layer.
In Li-ion batteries, intercalation is the primary insertion mechanism, and the majority of the electrode materials, both positive and negative, follow the same mechanism. This mechanism can be seen in Figure 2.
Many electrode compounds, like LiCoO2 (LCO), LiMn2O4 (LMO), Li4Ti5O12 (LTO), LiFePO4 (LFP), and LiNiMnCoO2 (NMC) are common instances in which this mechanism for Li-ion batteries is supported.
Within these listed compounds, only LTO can be used as a negative electrode. The remaining compounds react with lithium ions at higher potentials, and thus are appropriate as cathode materials.
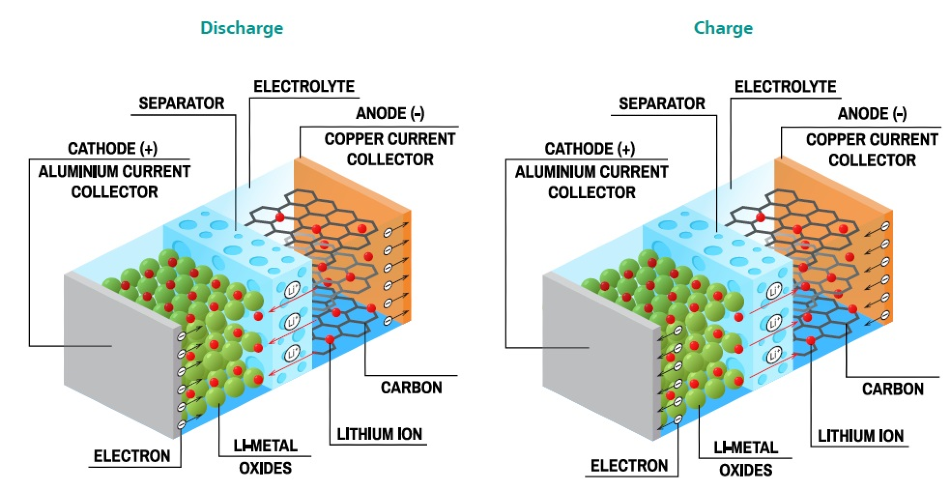
Figure 2. Schematic showing the intercalation mechanism in Li-ion batteries through charge and discharge. Image Credit: Metrohm AG
Alloying
The mechanism of Li insertion can be different in comparison to the primary mechanism of intercalation. Research has shown that at room temperature, Li-ions can electrochemically react with several metals, including gold, zinc, tin, silicon, and more.
When the lithium insertion reaction takes place, Li-ions create a Li-metal alloy giving way to the mechanism known as alloying.
When the reverse electrochemical reaction takes place, de-alloying occurs. For instance, when considering silicon, the alloying process leads to the formation of the compounds Li12Si7, Li14Si6, Li13Si4, and Li22Si5. Silicon accepts a large amount of lithium per atom, resulting in a growth of up to 300% on the silicon electrode.
This growth leads to electrical isolation of the silicon particles and additional side reactions occurring most frequently on the reformation of the SEI layer, resulting in fading of the silicon anode upon cycling, eventually leading to failure.
A well-known electrolyte additive is FEC, which is widely reported as being an acceptable solution to suppress the side reactions when using a silicon anode. However, thus far, utilizing pure silicon anodes remains to be difficult, and silicon use is limited to a small scale in the carbonaceous anodes, at approximately 10–15%.
Theoretical Capacity of Active Materials
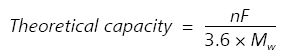
In general, an active materials theoretical capacity (in mAh/g) can be calculated using the following equation:
 |
(3) |
This equation is explained as n being the number of electrons that are exchanged, F represents the Faraday constant (96485 C/mol), 1/3.6 is the conversion factor from A∙s to mAh, and Mw (g/mol) shows the active materials’ molecular weight.
With LCO as the example, the molecular weight of this positive electrode compound is 97.868 g/mol, 1 is the number of exchanged electrons, and therefore LiCoO2 has a theoretical capacity of 273.85 mAh/g. The resulting number is a theoretical value, though, and so presents as higher than its practical capacity value of around 150 mAh/g.
Active Materials and Electrode Preparation
For Li-ion batteries, in order to investigate a possible material for suitable anodes or cathodes, a combination of active materials with a proper conductive agent and a binder is required.
The performance of the final electrode is affected by the percentage of each component in the electrode composite. This combination of materials, also referred to as a “slurry,” is coated on a suitable current collector.
In environments for academic research, the coating is normally applied either manually or by an automated doctor-blade film coater. To further enhance the conductivity of the electrode, and to increase the density of the electrode, the electrodes are required to go through the compressing phase.
Compressing the electrode reduces the surface area of the electrode, leading to a lower number of side reactions. Drying steps follow subsequently, where vacuum ovens are used on the film to ensure the battery materials are free of water.
Cells comprising of H2O, would be negatively affected by excess gas generation (typically hydrogen and carbon dioxide) and swelling, which results in mechanical stress to the device that is being driven by the cell. Additionally, it could reduce the stack pressure, especially in the case of pouch cells, resulting in a growth in the internal impedances and an energy density reduction.
Cell Preparation
Traditionally, Li-ion battery materials are sensitive to air and water. Although the electrode materials are synthesized in a discharged state and are thus inactive in the atmosphere, it is required for the materials in the final cell to be free of water. Due to this, it is vital to have access to a water-free glovebox with a non-reactive atmosphere, for example, argon.
A variety of types of cells can be utilized for Li-ion battery research, such as three electrode cell setup, coin cells, pouch cells, Swagelok cells, advanced, and custom-made cells. The two-electrode coin cell is the most popular and is largely used in battery research and development.
Commonly, a “half-cell” configuration is used during materials study because it is preferred due to the metallic lithium acting as a negative electrode. When study of the complete battery is of interest, a “full-cell” configuration is required, and therefore the electrodes, proper anode, and proper cathode materials are used.
For the half-cell configuration, it is vital to remember that the lithium ions source is unlimited, but for the full-cell configuration, the quantity of active lithium is limited by the cathode material capacity. Due to this, the loss of lithium ions in the side reactions will be recovered from the metallic lithium foil in the half-cell configuration.
On the other hand, the full-cell configuration lithium loss leads to a decreased lithium source of the cathode material and a capacity loss. This loss is extremely important when, for instance, the silicon anode’s performance is being studied.
Setup of the Experiment
In this study, experiments were performed using a Metrohm Autolab PGSTAT302N armed with an Electrochemical Impedance Spectroscopy module (FRA32M) and Booster 10A, as displayed in Figure 3.
For data acquisition and analysis, NOVA 2 software was used. The batteries used in this experiment were 18650 cylindrical batteries with a nominal capacity of 2600 mAh. They had a nominal potential of 3.7 V, and an operational voltage window of 3 V - 4.2 V. Prior to this experiment, the 18650 cells were used for an unknown number of cycles in other studies.
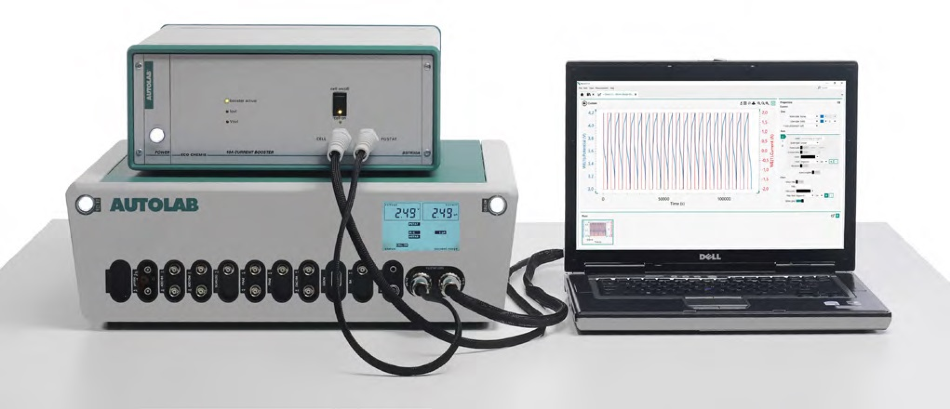
Figure 3. The Autolab PGSTAT302N with the FRA32M module and the Booster10A. Image Credit: Metrohm AG
Galvanostatic Charge-Discharge Cycling
Li-ion batteries have a sensitive reaction to overcharge and unsafe potentials. The main method of studying Li-ion battery materials is galvanostatic (constant current) charge/discharge cycling.
During this method, the operator can make sure that the battery remains within a safe operating potential. It contains a sequence of charge and discharge cycles in galvanostatic mode within a specific potential window.
Using this method, the cycle life, voltage behavior, and coulombic efficiency of batteries or battery materials can be investigated. In order to guarantee the fully charged or discharged state of the battery, particularly at higher C rates, a constant voltage phase between each charge and discharge can be added to the process.
What is the “C-Rate”?
The C-rate describes how quickly or slowly the cycling is done and is an indication of the rate of cycling. For instance, 1C rate shows that the given current can charge or discharge the battery in 1 hour.
2C represents that the given current corresponds to an overall time of 30 minutes for either a charge or discharge. Lastly, C/2 represents a rate meaning the battery can be fully charged or discharged in 2 hours. For instance, 1C rate for the 18650 cylindrical cell with a nominal capacity of 2600 mAh would be 2.6 A.
Constant Current Constant Voltage (CCCV) is the name given to the combination of these two galvanostatic and potentiostatic techniques, and it is also the charging protocol for commercial chargers. The CV section remains the same until the current dips lower than a particular threshold.
Figure 4 displays an example of galvanostatic charge discharge cycling of a 18650 cell with a nominal capacity of 2600 mAh within a potential window of 3 V - 4.2 V at 1C. The potential vs. time plot gives a summary of the voltage characteristic of the battery upon cycling.
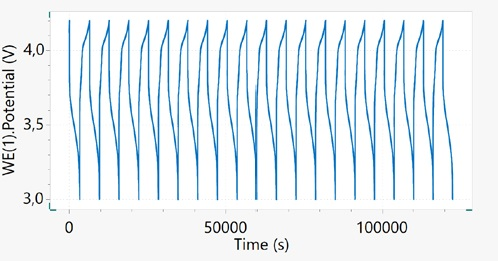
Figure 4. Potential vs. time plot for the 18650 Li-ion cell cycled at 1C. Image Credit: Metrohm AG
For a better summary of the voltage profile changes of the battery over cycling, the time of each cycle can be amended, beginning at zero seconds. This approach can be seen in Figure 5 to show the potential vs. time plot.
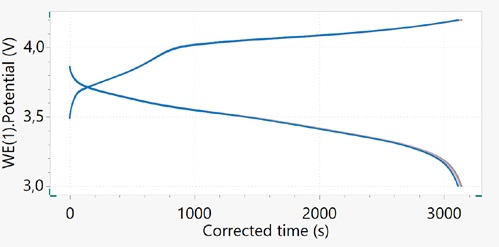
Figure 5. Potential vs. corrected time for the 18650 Li-ion cell cycled at 1C. Image Credit: Metrohm AG
Capacity is one of the key characteristics of a battery or battery material. It can be calculated using the equation:
| Capacity (mAh) = Time (h) × Current (mA) |
(4) |
Therefore, it is easy to explore the commonly used plot of capacity versus potential. Figure 6 displays the capacity versus the potential plot of the 18650 cell, shown for cycle 1 only.
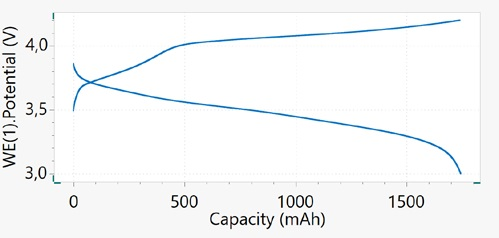
Figure 6. Capacity vs. potential plot upon charge/discharge cycling of a Li-ion battery at 1C rate, cycle 1. Image Credit: Metrohm AG
Additional data analysis can be performed depending on the scope of the experiment (e.g., dQ/dV vs. V and dV/dQ vs. Q), which emphasizes the small characteristics in the potential versus capacity plot.
The voltage profile of 18650 cell is illustrated in Figure 7, cycled at ~ C/15, and its corresponding dQ/dV vs. V plot for one cycle. dQ/dV analysis was executed by NOVA 2 software, and the dQ/dV peaks are noted with their corresponding plateau in the voltage profile of the cell during the charge. During the cycling of the battery, both peak position and peak height could experience changes.
These data are valuable for gaining knowledge about the aging mechanisms in batteries during their cycle and calendar life. For instance, the fluctuating of charge peaks to higher voltages proposes an increase in the internal resistance of the battery during its cycling.
Shrinkage of these peaks during cycling suggests a reduction in the capacity corresponding to the relevant plateau in the voltage profile of the battery.
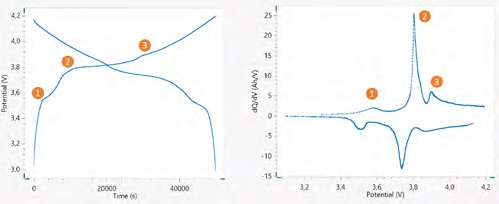
Figure 7. Voltage profile of the 18650 Li-ion battery. On the left, cycled at ~ C/15, and on the right, its corresponding dQ/dV versus V plot. Marked in the figures are the corresponding peaks and plateaus. Image Credit: Metrohm AG
It is vital to investigate the capacity fade of a battery over long-term cycling. This calculation is executed by tracking the charge and discharge capacities versus the cycle number. A typical capacity versus cycle number plot for the battery used in this experiment is shown in Figure 8.
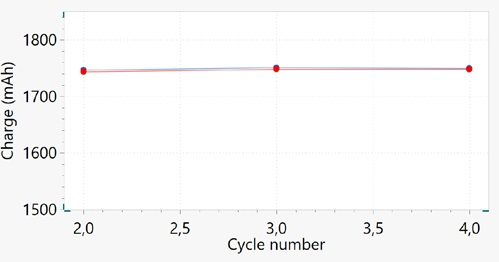
Figure 8. Capacity versus cycle number plot for cycles 2, 3, and 4. Blue and red dots correspond to charge and discharge capacity, respectively. Image Credit: Metrohm AG
Just three cycles can be seen. As mentioned previously, the battery in this experiment has a nominal capacity of 2600 mAh, but the capacity measured for these cycles is approximately 1750 mAh at 1C, displaying around a 33% reduction in comparison to its nominal capacity.
The energy density of a battery can be calculated using the equation:
| Energy density (Wh/kg) = Capacity (Ah/kg) × Voltage (V) |
(5) |
For the energy density of a battery to increase, it is vital to investigate materials with higher capacity and/or cathode materials with higher operating potential.
Certainly, it is required that this is done relative to the specific volume or mass. For instance, for a 18650 battery with a nominal capacity of 2600 mAh, a nominal potential of 3.7 V, and the total mass of 46 g, the energy density is approximately 209 Wh/Kg.
The C-Rate applications range in their requirements of energy release. Some need a fast release of energy, whereas others need a continuous release over a sustained period. Another variation in battery chemistry is rate performance. Due to this, it is vital to consider battery chemistry, which is appropriate for the specific application, bearing in mind the required power.
As previously explained, the C-rate shows the rate of cycling and describes how quickly or slowly the cycling is completed. Figure 9 displays the cycling of a 18650 battery at varying C-rates. It can be seen that higher C-rates produce a lower cycling time, but the capacity retained also reduces with a growing C-rate.
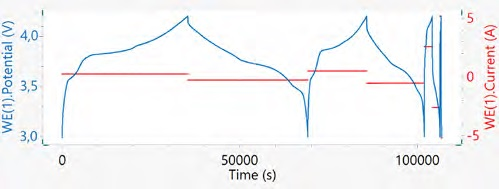
Figure 9. The left axis displays potential vs. time, and the right axis shows current vs. time of four consecutive cycles at C/10, C/5, C, and 2C rates. Image Credit: Metrohm AG
The discharge potential profile versus the capacity at different C-rates is shown in Figure 10. This plot provides a better summary of the capacity retention and voltage profile at varying C-rates. A decreasing trend is seen in the capacity when the C-rate is increased.
This trend is more clearly seen at a high rate of 2C, where the battery can retain only about 12% (320 mAh) of its nominal capacity. On the other hand, for a lower rate of C/5, the capacity retained is about 90% (2340 mAh) of its nominal capacity of 2600 mAh.
From these results, it is clear that this battery technology is unsuitable for high power applications in which the battery is required to have the capabilities of delivering energy in a shorter period.
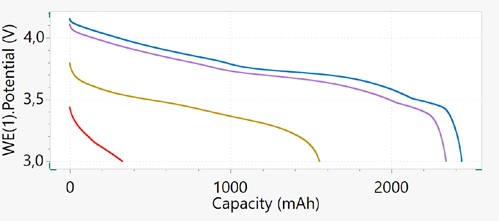
Figure 10. Plot of discharge potential vs. capacity at different C-rates: C/10 (blue), C/5 (purple), C (brown), and 2C (red). Image Credit: Metrohm AG
On inspection of the discharge voltage profile of the battery, the presence of the voltage plateau at varying depths of discharge can be seen. The plateau in the voltage profile of the battery illustrates two phases coexisting on the battery electrode.
If discharging of the battery occurs upon the formation of a non-stoichiometric compound on one of the electrodes, then discharging the battery, even more, would cause a steady change in potential rather than causing a plateau.
Upon viewing the voltage profile of the battery at higher rates, the fading of plateaus that formed in voltage profiles of the same battery cycled at lower C-rates are displayed.
Coulombic Efficiency (CE)
The coulombic efficiency of a cell is explained as the ratio of the number of charges delivered during the discharge to the number of charges kept in the battery during the initial charge. CE is calculated using the equation:
 |
(6) |
Commercial Li-ion batteries have a coulombic efficiency similar, but never equal to, the ideal value of 100%. In theory, a Li-ion battery would last forever when the coulombic efficiency is 100%. However, this is, of course, not the case, and there is a fraction of charge lost at every cycle.
The charge lost at each cycle predominantly comes from side reactions resulting from the formation or repair of the SEI layer. Other side reactions, such as electrolyte oxidation, dissolution of transition metals, active materials loss from the current collector, and Li plating at the anode, could take responsibility for the loss of capacity at each cycle.
Figure 11 displays the CE versus cycle number for a Li-ion cell cycled at C/10. On the y-axis, it can be seen that the values are close to 100% and follow a trend that is increasing. The CE values are usually lower at early cycles for a brand-new cell.
As the battery ages, there is an increase in the coulombic efficiency as the amount of side reaction reduces over the time/cycle when the battery matures. Coulombic inefficiency (defined as “1 – CE”) could be a more suitable value in considering capacity loss at each cycle.
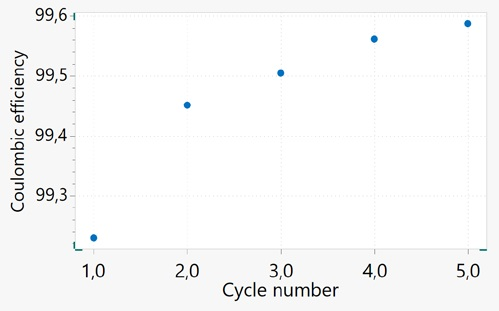
Figure 11. Coulombic efficiency plotted against the cycle number for the aged 18650 battery. Image Credit: Metrohm AG
A cell’s coulombic efficiency is an extremely helpful parameter to help understand the level of side reactions with a variety of battery technologies.
As an evaluation parameter, one of the key benefits of the coulombic efficiency is the potential to assess the performance of the battery over a short period. However, accurate measurements are important and must be supported by precise control of battery temperature.
Electrochemical Impedance Spectroscopy (EIS)
One of the aims of research into batteries is to minimize internal resistance. With EIS, there is potential to measure the internal resistance of the battery. This is alongside modeling it with an electronic circuit to gain a better understanding of the main cause of impedance within the battery components.
A minimum impedance must be seen in any potential electrode material and electrolyte. It is vital to have a correct connection to the batteries to attain an impedance spectroscopy measurement that is accurate. A suitable cell connection for EIS measurement of batteries is the 4-point Kelvin configuration, where current leads and voltage leads are kept separate.
Figure 12 displays the Nyquist plot at room temperature for the 18650 cylindrical cell at a fully discharged state (3 V). The EIS measurement is done in potentiostatic mode. From the properties of the Nyquist, parameters needed for the equivalent circuit fit can be identified easily.
In this diagram, L is the inductance given by the cables, and Rs shows a series of resistance corresponding to the battery terminals, cables, and mainly electrolyte resistance. RCT is the charge transfer resistance, between the electrode and electrolyte, CDL is the double layer capacitance, which corresponds to the SEI layer, and Wdiff is the diffusion impedance, modeled by a Warburg element (semi-infinite transmission line) at low frequencies.
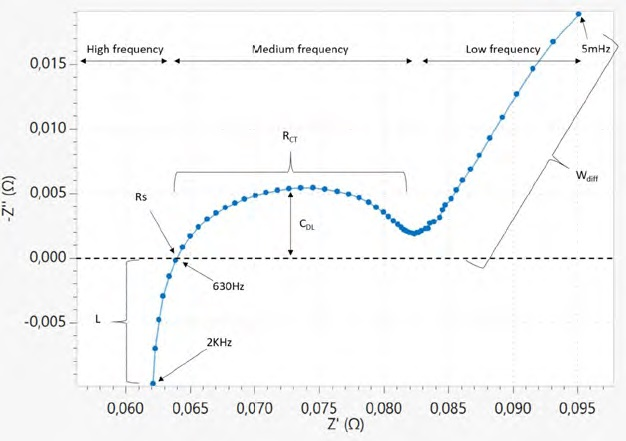
Figure 12. Nyquist plot: Negative imaginary part of impedance as a function of the real part of impedance for the 18650 cell. Image Credit: Metrohm AG
Figure 13 displays the Bode plot corresponding to the same EIS measurement of the 18650 cell. It shows the real impedance and phase are plotted as a function of the logarithm of the frequency.
Bode plots have the potential to compare impedance at the same frequency and are very helpful for comparison of the impedance of negative and positive symmetric cells and full cells in post-mortem EIS analysis of the batteries.
For EIS measurement, a symmetric cell of cathode/cathode and anode/anode could be created, and preferably the sum of these impedances divided by two should be equal to the overall impedance of the full cell. This method helps to learn more about the separate electrochemical processes at the cathode side and anode side of the battery.
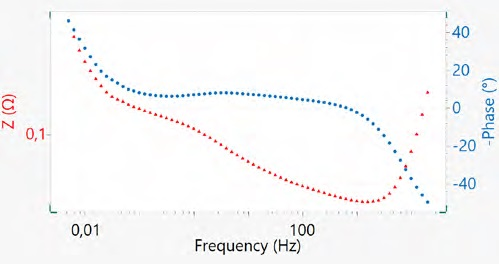
Figure 13. The bode plot of the 18650 Li-ion cell. Image Credit: Metrohm AG
The EIS characterization can be performed at different states of charge, which correspond to different cell potentials. If needed during battery charge or discharge, the EIS can also be done in galvanostatic mode, in which a current perturbation is sent to the battery instead of a potential.
Figure 14 displays the EIS measurement at different states of charge. The battery was put in galvanostatic mode to change the state of charge and subsequently and charged up to a specific potential. Then, the battery was left at open circuit potential to relax for approximately 2 hours.
A long relaxation time is required for the battery’s equilibrium condition to be reached. Although the features in the Nyquist plot do not show a dramatic change, there is an overall decrease in impedance when charging the battery to higher states of charges.
The changes are mainly at medium and low frequencies, where diffusion resistance and charge transfer resistance are affected at varying states of charge. Tracking the impedance of the battery upon the cycling is also important.
When characterizing the impedance over battery cycling, for example, after 50, 100, or 500 cycles, the impedance experiments must be completed at a fixed potential so a correct comparison can be made.
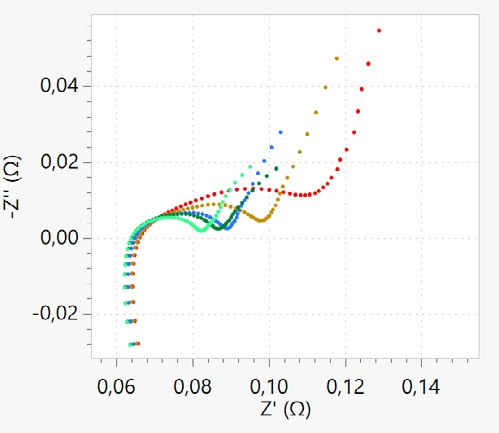
Figure 14. Nyquist plot corresponding to EIS measurement completed at different potentials of 3 V (red), 3.4 V (brown), 3.7 V (blue), 3.9 V (green) and 4.15 V (light green). Image Credit: Metrohm AG
Alternative Technologies to Li-ion Batteries
In addition to Li-ion batteries, presently, the primary rechargeable battery technology, research, and development are being completed on alternatives in battery chemistries, for example, Li-Air, Li-Sulfur, Na-ion, and solid-state batteries, to name a few.
However, commercialization has been hindered due to these other cell chemistries facing a variety of difficulties. Yet, interest in these alternative technologies continues to grow as promises for a variety of benefits are made concerning Li-ion batteries.
Summary
This study summarizes the key principles and techniques used to investigate battery performance and the performance of other battery materials. It is important that high-quality instrumentation can be accessed to guarantee accurate measurements.
Two key methods to investigate the performance of batteries and battery materials are constant current cycling and electrochemical impedance spectroscopy. With constant current cycling, there is potential to calculate values such as coulombic efficiency and capacity over cycling, in addition to gaining a better understanding of the possible characteristic of the battery and its rate capability.
Furthermore, additional analysis of the data (for example, dV/dQ versus Q and dQ/dV versus V) can lead to a more detailed understanding of the changes in the potential profile of the battery. A more detailed analysis is extremely interesting when studying the failure mechanism of the battery, or the battery materials, in particular.
With EIS, there are capabilities to measure the internal resistance of the battery. There is also the possibility of modeling resistance using the equivalent circuit and understanding the battery components’ contribution to the impedance of the cell.
During the preparation of the battery electrode, when using the active material slurry, care should be taken regarding its mechanical stability when deposited on the current collector as it is a potential source of failure.
When investigating the constant current charge and discharge in a half-cell configuration, it must be considered that the lithium source is unlimited, and a cumulative capacity loss approach is required to resemble the performance in a full-cell configuration.
Evaluating battery performance involves an extremely interesting parameter that needs to be calculated: coulombic efficiency. The coulombic efficiency calculation needs to be accurate and precise to be able to make a comparison between technologies with very similar behaviors at early cycles. This calculation needs highly precise instrumentation and accurate control of the test temperature.

This information has been sourced, reviewed and adapted from materials provided by Metrohm AG.
For more information on this source, please visit Metrohm AG.