No-slip boundary condition is one of the common assumptions in rheological analysis, especially for polymer melt flow in capillary rheometers. In fluid dynamics, this assumption means that at the wall of a capillary die (also known as a slide boundary), the melt has zero velocity relative to the boundary or wall.
This assumption always exists for Newtonian fluids. However, for polymer melts, and particularly for high molecular weight molten polymers, they may slip at the wall of capillary die when the wall shear stress exceeds a critical value.
This is an undesired phenomenon and is known as slippage; it reduces apparent viscosity. Additionally, it causes appearance distortion, meaning that the surface of the extrudate begins to be rough.
It is important to understand wall slippage when using a capillary rheometer for rheological analysis. One of the reasons for mismatched rheological data obtained from various dies with various geometries (and of various diameters) could be wall slippage.
Calculating the wall slip velocity and understanding the slippage at the test condition means that it is possible to correct the rheological data for slip effects. In the extrusion industry, it is also undesirable to have wall slippage is undesirable because it can cause extrudate distortion, changing the final product’s appearance.
The appearance distortion’s intensity can vary from a gross melt fracture to loss of gloss or sharkskin. Production design rate can be severely impacted by these appearance defects meaning that having a clear understanding of wall slippage phenomena is important.
Additionally, it is necessary to do wall slip for modeling and simulation of the injection molding process. Wall slip is more significant in small flow channels, meaning it is particularly important for micro-injection molding.
The image below illustrates various levels of extrudate distortion caused by wall slippage. An extrudate with a glossy and smooth surface is shown in the first picture from the left.
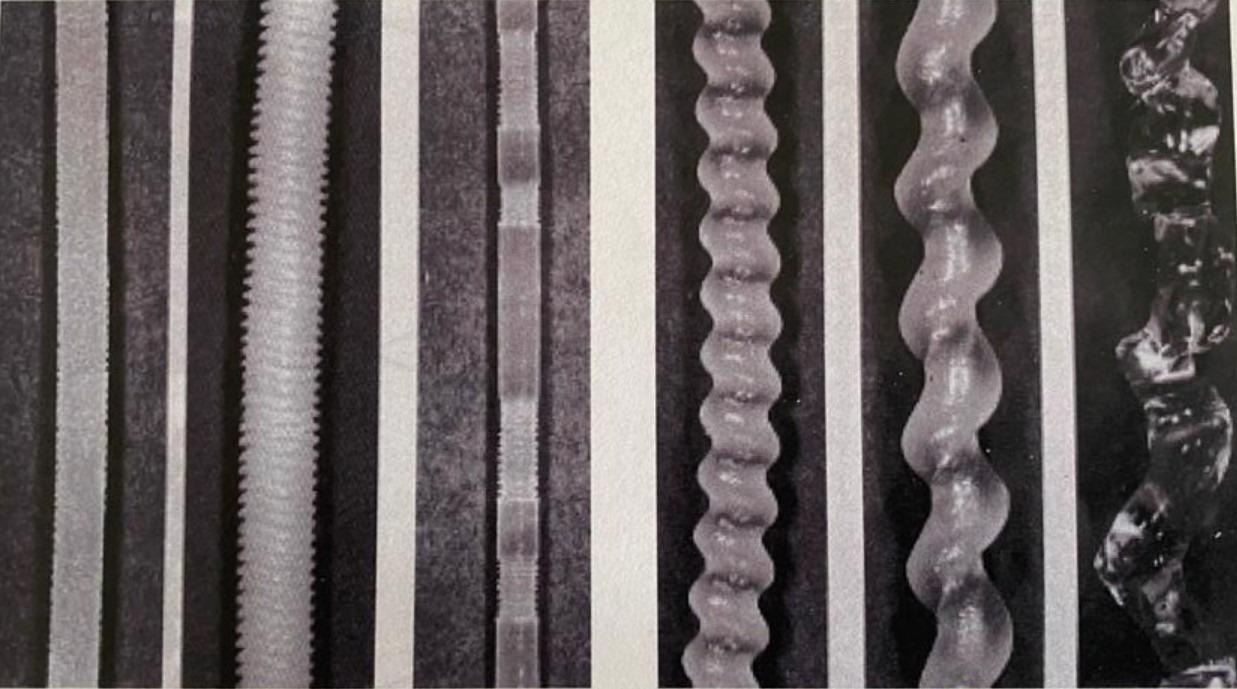
Image Credit: Dynisco
The processing of the first extrudate has not had any wall slip. However, the image second from the left shows an extrudate that has some sort of surface roughness with a shape not unlike a screw thread.
This mild surface distortion happens because of deviations from a no-slip boundary condition and is known as sharkskin. This happens specifically for wall shear stresses greater than a critical value and occurs when extrusion is done at high shear rates.
From the left, the third extrudate has been processed at higher shear rates; specifically, shear stresses greater than a second critical value and shows an alternating pattern of rough and glossy surfaces.
This type of appearance distortion is usually observed in highly entangled linear polymers and is caused by the oscillatory flow of molten polymer chains at the wall interface, known as oscillating stick-slip behavior.
The fourth, fifth and sixth images show extrudate that has been processed at even higher shear rates; the images show gross melt fractures known as helical and wavy extrudate surface. The final image shows extrudate that has a chaotic surface caused by high intensity wall slippage, or velocity profile become almost plug flow.
The issue of wall slippage is more significant for polymers with narrow molecular weight distribution and high molecular weight. It is possible that these polymers may experience both weak and strong steps of wall slippage at two critical stress stages.
A discontinuity on the polymer flow curve can be caused by this transition from weak to strong slippage. Another way to put this is that a discontinuity of the flow curve may be signaling a transition from weak slip (normally happens at shear stress around 0.1 MPa) to a strong one (happens around 0.2-0.3 MPa).
Detachment of some chains at the polymer/wall interface is the mechanism of weak slippage in linear polymers. However, the mechanism of strong slippage is the sudden bulk disentanglement of the polymer chains from a monolayer of polymer chains that have been adsorbed at the interface of the wall.
The discontinuity of flow curve (stick-slip oscillating flow) and transition from weak to strong slip may be insignificant or possibly not even observed for polymers with broad molecular weight distribution and branched polymers.
Slip starts at a critical shear tress for these polymers and the slip then gradually increases alongside the shear tress until the velocity profile becomes almost plug flow.
Some factors that impact the degree and type of extrudate distortion and wall slippage are listed below:
- Process condition (temperature, flow rate): Decreasing the flow rate or increasing temperature (or decreasing the speeds to process at a lower shear rate) decreases the severity of extrudate distortion and wall slip
- Die geometries (die material construction, entrance angle, length, diameter): Decreasing the die entrance angle or increasing the die length or die diameter results in a decrease of the extrudate distortion and wall slip.
- Polymer molecular structure (branching structure, molecular weight distribution, molecular weight, chemical nature of polymer): Brader molecular weight distribution, lower molecular weight, and branched structure decreased the severity of extrudate distortion and wall slip.
How should wall slip velocity in capillary rheometer be calculated?
Assuming no slip at the wall, the apparent shear rate (assuming no slip at the wall) based on classical fluid dynamics is calculated as shown:
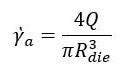 |
(Equ. 1) |
where Q is the volumetric flow rate (mm3/s), Rdie is capillary die radius (mm), and ẏa is apparent shear rate (1/s).
Q can be shown as a factor of average velocity inside the die (V) as shown below:
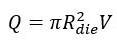 |
(Equ. 2) |
By replaying equation 2 into equation 1:
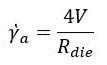 |
(Equ. 3) |
If no slip occurs during polymer melt flow, the two equations above are valid. However, if there is wall slippage, V needs to be replaced by (V-Vs) as follow:
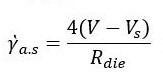 |
(Equ. 4) |
where ẏa.s is apparent shear rate when slip is occurring, and Vs is the slip velocity at wall. By replacing equation 3 into equation 4:
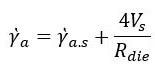 |
(Equ. 5) |
In case of wall slip occurrence, based on equation 5, the flow curve of the molten polymer will be a function of die radius or diameter.
In order to calculate wall slip velocity, the below steps needs to be performed:
- Produce a series of flow curves using a set of dies of varying radius but constant L/D (to keep the effect of pressure constant).
- At a given value of shear stress, make the plot of apparent shear rate versus inverse radius. This plot is called Mooney plot.
- Slip velocity at given shear stress will be one-quarter of the slope of plot (Mooney plot).
- Repeat the test at other shear stresses and calculate the slip velocity at each specific shear stress.
- Make the plot of slip velocity versus shear stress.
The below graphs show the data from Dynisco capillary rheometer (LCR) for measurements of wall slip velocity using various sets of dies. Flow curves were obtained using three sets of dies with different diameters (1mm, 2mm, and 3mm). For each die diameter, three L/D ratios of 4, 10, and 20 were selected.
All the experiments were performed on linear low-density polyethylene (LLDPE) materials at a temperature of 190°C and shear rate range of 10-290 1/s. Figure 1 shows the flow curves for each set of die (Step 1).
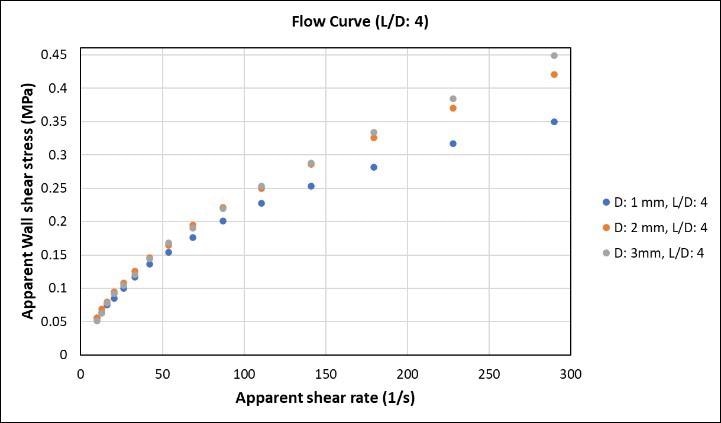
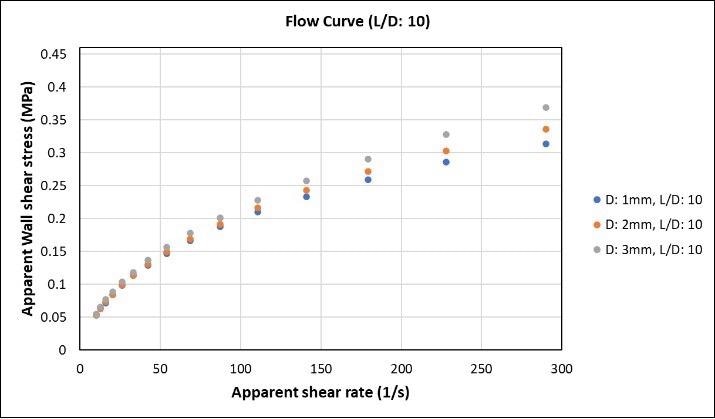
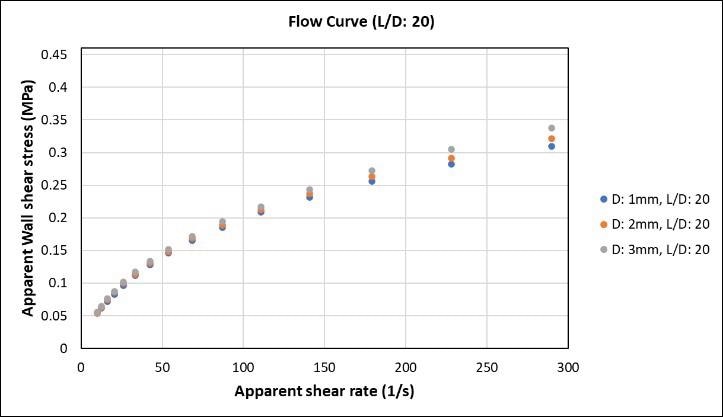
Figure 1. Flow curves of LLDPE materials using various dies. Image Credit: Dynisco
The moony plots are shown in Figure 2. These are apparent wall shear stress versus inverse radius at various wall shear stress different L/D and using various sets of dies, as shown in step 2.
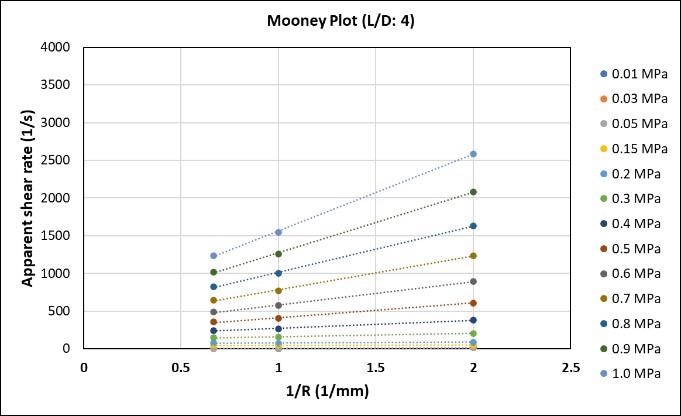
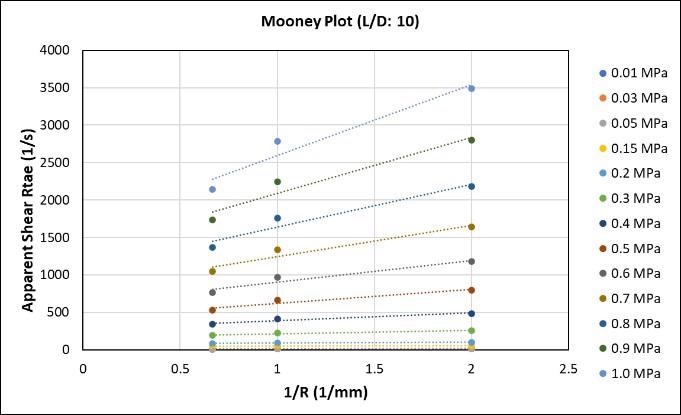
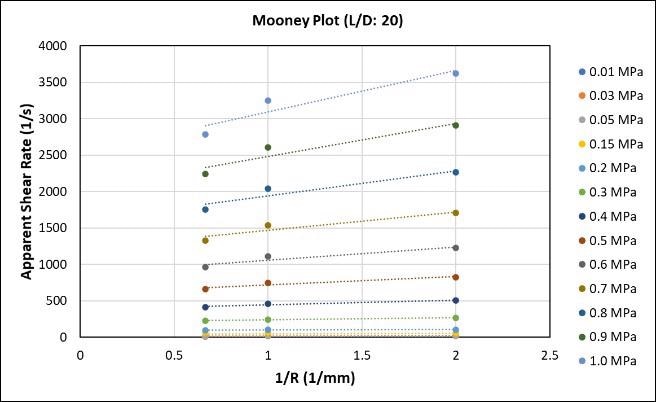
Figure 2. Mooney plots. Image Credit: Dynisco
Increasing the shear stress also increases the slope of the fitting lines, indicating that wall slip velocity is a factor of shear stress and it increases with increasing shear stress.
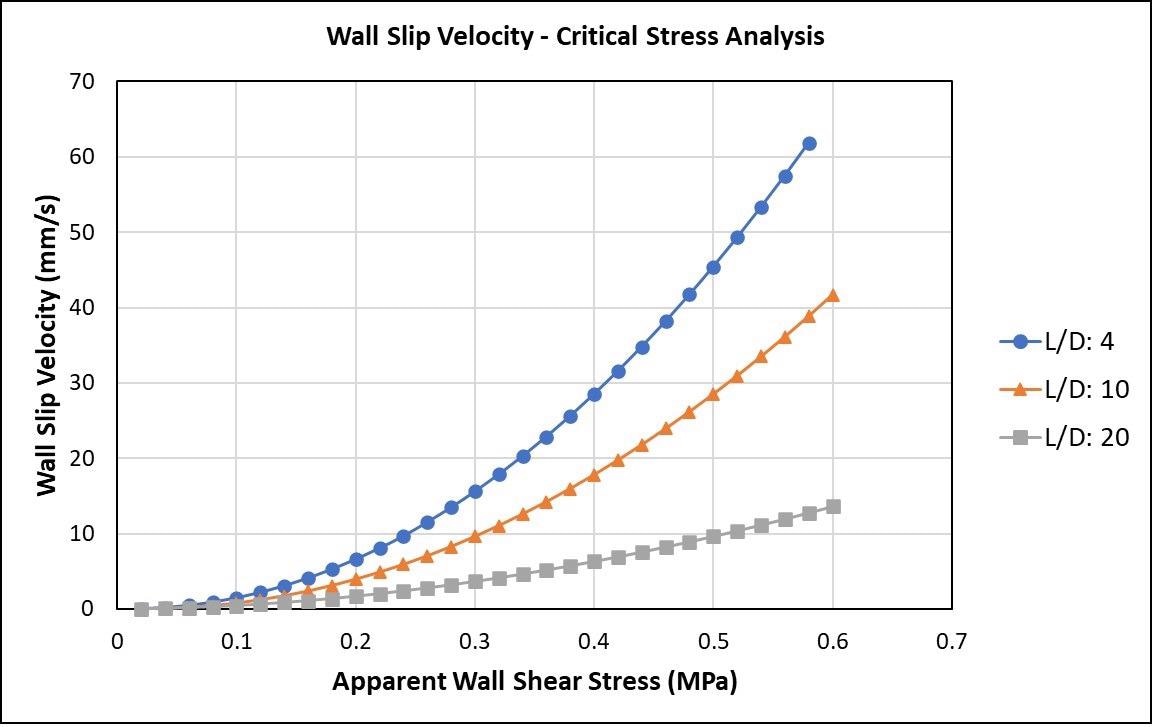
Figure 3. Graph of wall slip velocity versus apparent wall shear stress. Image Credit: Dynisco
Figure 3 shows the graph of shear stress versus wall slip velocity for three sets of dies with different L/D.
It is possible to use Figure 3 to understand the critical shear stress and for the calculation of velocity of the wall slip. As shown, the wall slip velocity starts to increase dramatically at specific shear stress (critical shear stress) for die.
Reference
- Filip, P., Hausnerova, B., Sanetrnik, D. and Hnatkova, E., 2019, May. Wall slip of highly filled powder injection moulding compounds in dependence on capillary die geometry. In AIP Conference Proceedings (Vol. 2107, No. 1, p. 030005). AIP Publishing LLC.
- Aho, J., Boetker, J.P., Baldursdottir, S. and Rantanen, J., 2015. Rheology as a tool for evaluation of melt processability of innovative dosage forms. International journal of pharmaceutics, 494(2), pp.623-642.
- Hausnerova, B., Sanetrnik, D. and Paravanova, G., 2014, May. Wall-slip of highly filled powder injection molding compounds: Effect of flow channel geometry and roughness. In AIP Conference Proceedings (Vol. 1599, No. 1, pp. 518-521). American Institute of Physics.
- Sajjadi, S.P., 2016. Impact of die materials on the effect of new polymer processing aids for sharkskin properties. Journal of Materials Science and Chemical Engineering, 4(9), pp.17-27.
- Chen, Y., Luo, W., Li, Y., Zou, H., Liang, M. and Cao, Y., 2014. Melt flow instabilities in polyethylene resins. Polymer Science Series A, 56(5), pp.662-670.
- Dealy, J.M. and Wissbrun, K.F., 2012. Melt rheology and its role in plastics processing: theory and applications. Springer Science & Business Media.
- Hatzikiriakos, S.G., 2012. Wall slip of molten polymers. Progress in Polymer Science, 37(4), pp.624-643.
- Hristov, V., Takacs, E. and Vlachopoulos, J., 2006. Surface tearing and wall slip phenomena in extrusion of highly filled HDPE/wood flour composites. Polymer Engineering & Science, 46(9), pp.1204-1214.
- Chien, R.D., Jong, W.R. and Chen, S.C., 2005. Study on rheological behavior of polymer melt flowing through micro-channels considering the wall-slip effect. Journal of Micromechanics and Microengineering, 15(8), p.1389.

This information has been sourced, reviewed and adapted from materials provided by Dynisco.
For more information on this source, please visit Dynisco.