High speed dielectric cure monitoring (DEA) has the singular capacity to assess cure in real-time under real process conditions. Such monitoring is beneficial for the study of materials that polymerize in a matter of seconds, such as H.B. Fuller U33451, a UV curable, modified acrylate adhesive.
Under UV irradiation, U3345 rapidly reacts and displays dynamic behavior that would be almost impossible to observe with alternative methods. The practicality of dielectric cure monitoring facilitates the study of degree of cure and the response of UV-curable materials to exposure and irradiance.
Dielectric Cure Monitoring
Dielectric cure monitoring, otherwise known as Dielectric Analysis (DEA), measures the resistivity (ρ) and permittivity (ε’) of a polymer, which are the dielectric properties of a material. Resistivity itself has a frequency independent (ρDC) component as a result of the flow of mobile ions and a frequency dependent (ρAC) element because of the rotation of stationary dipoles.
While often referred to as DC resistivity, in reality frequency independent resistivity reaches across a range of frequencies such as DC (0 Hz). Due to the fact the thermoset’s degree of cure influences both mechanical viscosity and frequency independent resistivity, ion viscosity was the term coined to emphasize the relationship between the two. Ion viscosity (IV) can be defined as:
(eq. 1) IV = ρDC (ohm-cm)
This article outlines the data for log(ion viscosity), which will be referred to as log(IV) in short. As ion viscosity correlates with cure state, it is a practical material probe of epoxies, polyurethanes, polystyrenes and particularly UV- cured resins.
Dielectric Sensors
Dielectric cure monitors measure a material’s resistance (R) and capacitance (C) across two electrodes, which can be modeled as a resistance in parallel with a capacitance. A frequently used configuration is the interdigitated electrode, as seen in Figure 1; a Quarto-Varicon2 dielectric sensor was employed for this study. This sensor has been manufactured as a thin polyimide flex circuit with an electrode separation and width of 100 microns.
As a general principle, interdigitated electrodes with an equal width and separation measure to a depth almost equal to the electrode width. As a result, the sensor employed in this study makes a highly localized measurement, just 100 microns into the sample.
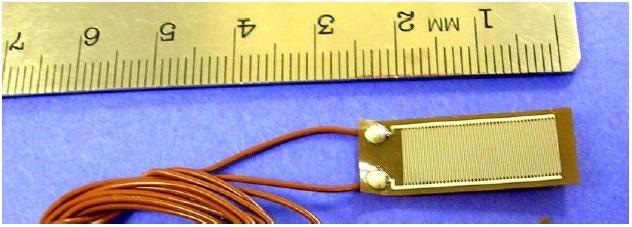
Figure 1. Dielectric sensor with interdigitated electrodes. Image Credit: Lambient Technologies
For UV curing, interdigitated sensors can be positioned within a sample and away from the surface to prevent confounding effects from oxygen inhibition, which inhibits cure at the interface with the atmosphere.
Ultraviolet Light Source
During this study, the SunSpot 2 UV/Visible Light Curing System3 was the UV source used. The high-power output from its arc lamp is wide-band and intensity at the end of the light guide is generally in the region of >18,000 mW/cm2 in UVA (320-390 nm), with settings that can be adjusted from I = 0 to I = 10 for intensity values spanning a range of 61% to 100%, respectively.
This UV source utilizes both a dichroic filter and mirror to significantly reduce IR transmission through the light guide. Nevertheless, the absorption of radiation in the residual visible/UVA/UVB/UVC wavelengths can generate substantial heating of samples at high intensities.
Procedure
The experimental set-up is illustrated in Figure 2. At the end of the light guide, a collimator focused the light and projected it onto a platform for the sample. Each test utilized a standoff of 15 cm, 20 cm, 38 cm or 48 cm separating the collimator and platform. The intensity of the UV source was set to I = 0, 5 or 10, corresponding to 61%, 83% or 100% of full intensity, respectively. This mixture of standoffs and settings facilitated an 18:1 range of irradiance at the sensor.
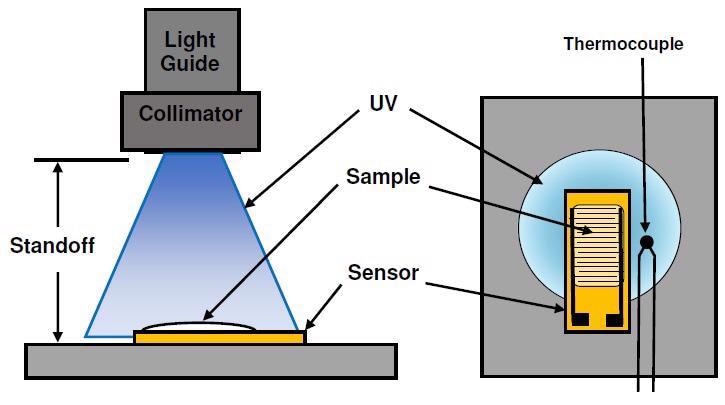
Figure 2. Test set-up for UV cure. Image Credit: Lambient Technologies
For each test, the application of U3345 UV-curable adhesive to a new dielectric sensor took place, resulting in a sample that was 7 mm x 20 mm in area and roughly 1 mm thick. The sample was positioned on the platform at the estimated center of the irradiance profile — a thermocouple beside the sensor allowed for monitoring of the temperature both during and after exposure.
Lack of a UV meter hindered direct measurement of irradiance, therefore it was approximately evaluated from the rising and falling temperature profile during a test. This data was then used to model a hypothetical thermal source for each exposure. It was assumed that the temperature of this hypothetical source was proportional to actual irradiance at the sample. This was then utilized to calculate the relative irradiances of Table 1. Without total UV power measurements, irradiance throughout a test is assigned a relative value from Table 1 to allow for comparisons among results.
Table 1. Relative irradiance. Source: Lambient Technologies
| Standoff |
UV Source Intensity Setting |
| I = 0 (61%) |
I = 5 (83%) |
I = 10 (100%) |
| 15 cm |
10.9 |
14.8 |
17.8 |
| 20 cm |
9.3 |
12.7 |
15.3 |
| 38 cm |
2.1 |
2.9 |
3.4 |
| 48 cm |
1.0 |
1.4 |
1.6 |
An LT-631 High-Speed Dielectric Cure Monitor4 measured ion viscosity with an excitation frequency of 100 Hz at a rate of 50 ms/data point. To make sure the entire cure was captured, the UV source was switched on five seconds after the start of data acquisition.
Cure from a Single, Low Intensity Exposure
The ion viscosity and temperature were measured for 60 seconds after a fleeting single exposure of U3345 to low intensity UV. Standoff was 48 cm and the UV source intensity was set to I = 0 with a one second exposure time. Table 1 displays the relative irradiance = 1.0.
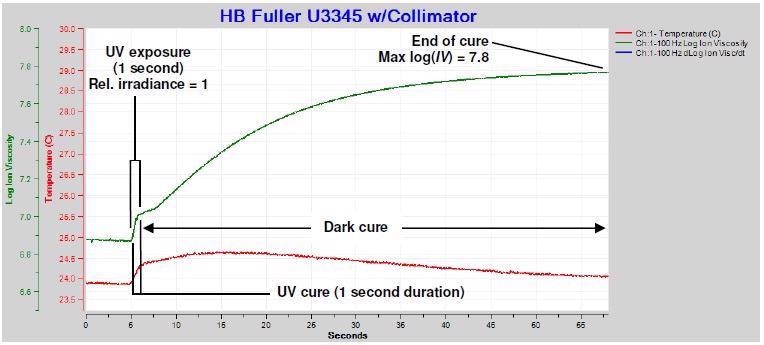
Figure 3. Ion viscosity of U3345, single exposure. Image Credit: Lambient Technologies
Ion viscosity data from this test, as shown in Figure 3, reports three events:
- UV cure throughout the exposure: At near-constant or constant temperature, there is an increase in the ion viscosity (IV) as the degree of cure increases. Furthermore, the adjustment in log(IV) typically possesses a linear or near-linear relationship with the alteration in degree of cure as assessed by glass transition temperature.5,6,7 Prior to irradiation the U3345 is at 0% degree of cure and the initial log(IV) = 6.9. In the course of the one-second exposure, ion viscosity abruptly increases in response to the photo-initiators activated, which initiate the curing process. Temperature also increases slightly as a result of light absorption.
- Dark cure after exposure: The photoinitiators that have been activated continue to drive cure, signified by the ion viscosity increase over a considerable amount of time after UV exposure ends. As the photoinitiators are consumed, the cure process decelerates and ion viscosity asymptotically moves towards a constant value.
- End of cure: The asymptotic value of log(IV) = 7.8 at the cure’s end, which takes place around 60 seconds after exposure.
Cure from Cumulative Exposures
To evaluate the effect of sequential exposures, three samples of U3345 at varying standoffs were each exposed for a period of one second, with UV source intensity = 0, at one-minute intervals. With each exposure, the samples, which had standoffs of 48 cm, 38 cm and 20 cm, have proportional irradiances of 1.0, 2.1 and 9.3, respectively. The results are displayed in Figure 4.
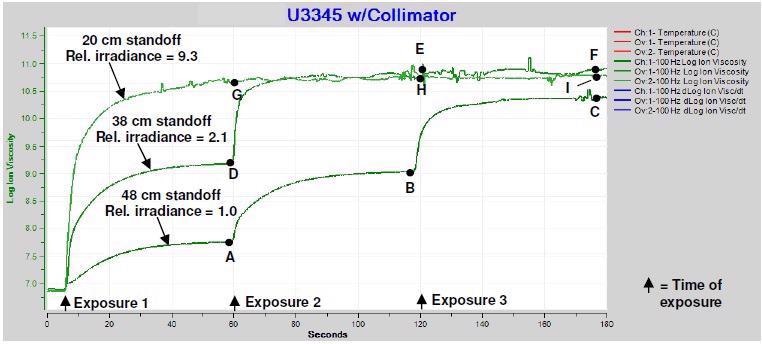
Figure 4. Ion viscosity of U3345, multiple exposures of one second each. Image Credit: Lambient Technologies
The plot of Figure 3 is the first minute of the data in Figure 4 for a 48 cm standoff. Although the reaction in Figure 3 effectively ends after approximately 60 seconds, Figure 4 clearly shows that cure is unfinished at this point.
The data also shows that the maximum log(IV) after each gradual cure is proportional to the cumulative exposure. In each case, increased ion viscosity also corresponds to an increased degree of cure.
The data demonstrates that two exposures at proportional irradiance = 2.1 are adequate to achieve a plateau of log(IV) ~10.8, while it is only necessary for one exposure at relative irradiance = 9.3. Also, once reaching the plateau, additional exposures have no influence on the ion viscosity level, signifying that the U3345 has achieved 100% degree of cure.
Table 2 outlines the relative irradiances and accumulative relative exposures for each test. Max log(IV) is the value at the end of cure subsequent to each exposure and is detailed in Figure 4 as well as being highlighted in Table 2. Figure 5 plots maximum log(IV) cumulative relative exposure.
Table 2. Standoff distances, relative irradiances and relative exposures. Source: Lambient Technologies
| Standoff |
Exposure Number |
Relative Irradiance at Sensor |
Cumulative Relative Exposure |
Max Log(IV) |
Degree of Cure |
Point |
| 48 cm |
1 |
1.0 |
1.0 |
7.75 |
20% |
A |
| 48 cm |
2 |
1.0 |
2.0 |
9.04 |
55% |
B |
| 48 cm |
3 |
1.0 |
3.0 |
10.37 |
90% |
C |
| 38 cm |
1 |
2.1 |
2.1 |
9.18 |
58% |
D |
| 38 cm |
2 |
2.1 |
4.2 |
10.87 |
100% |
E |
| 38 cm |
3 |
2.1 |
6.3 |
10.87 |
100% |
F |
| 20 cm |
1 |
9.3 |
9.3 |
10.79 |
100% |
G |
| 20 cm |
2 |
9.3 |
18.6 |
10.79 |
100% |
H |
| 20 cm |
3 |
9.3 |
27.9 |
10.79 |
100% |
I |
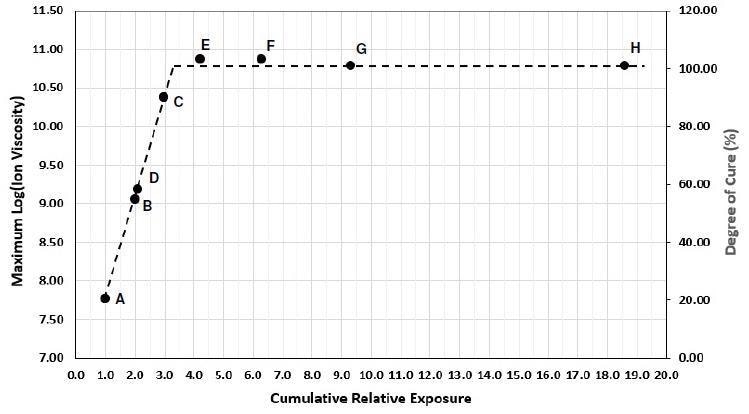
Figure 5. Max. ion viscosity of U3345 vs. cumulative relative exposure. Image Credit: Lambient Technologies
Where uncured resin with 0% degree of cure possesses a log(IV) = 6.9 and fully cured resin, presumed to be 100% degree of cure, possesses a log(IV) ~10.8. For a number of thermosets and polymers, the alteration in log(IV) is relative to the change in degree of cure. Therefore by interpolation it is feasible to correlate cumulative relative exposure with both a degree of cure and ion viscosity.
Figure 5 demonstrates log(IV) and degree of cure increase proportional to the cumulative exposure, until achieving a maximum value that is relative to total cure. This result was anticipated due to the fact the total amount of activated photoinitiator is proportional to the total irradiation, and the amount of enabled photoinitiator in turn determines the polymerization extent.
If absolute irradiance could be assessed at the sample, then it would be possible to relate cumulative exposure with the resulting degree of cure.
Conclusions
The real-time dielectric cure monitoring (DEA) of UV-cured resins can complement conventional laboratory tests to correlate degree of cure and exposure energy, identify degradation from over-exposure, and measure the effect of formulation on cure.
References
- U3345™ UV-curable adhesive, manufactured by H.B. Fuller Company, Batavia, IL USA. https://www.hbfullerproducts.com/products/h-b-fuller-u3345
- Quarto-Varicon™ sensor, manufactured by Lambient Technologies, Cambridge, MA USA. https://lambient.com
- SunSpot 2™, manufactured by Uvitron International, Inc., West Springfield, MA USA. www.uvitron.com
- LT-631™ High Speed Dielectric Cure Monitor, manufactured by Lambient Technologies, Cambridge, MA USA
- Application Note 3.22, “Cure Index and Degree of Cure,” Lambient Technologies, Cambridge, MA USA.
- J.H. Chen, M.A. Octeau, M. Hojjati and A. Yousefpour, “Cure Cycle Optimization for Composite Panels Fabricated by RTM Using Dielectric Sensors,” National Research Council Canada, Institute for Aerospace Research, ICCM International Conferences on Composite Materials (2009)
- Day, D.R., “Dielectric Determination of Cure State During Non-Isothermal Cure,” Polymer Engineering and Science; 29(5):334-338, (August 2004).
- Application Note 3.21, “Measuring Degree of Cure with Dielectric Cure Monitoring,” Lambient Technologies, Cambridge, MA USA.

This information has been sourced, reviewed and adapted from materials provided by Lambient Technologies.
For more information on this source, please visit Lambient Technologies.