There is potential to improve process efficiency, the final product, and direct process optimization through process monitoring – specifically through tracking the chemical changes that occur as raw materials are taken through various stages to yield a finished product.
Variations in the aroma profile of food and beverage products make apparent changes during the steps of the process. Gas chromatography coupled with mass spectrometry (GC-MS) can be used to monitor the semi-volatile and volatile analytes that comprise the aroma profile.
This article uses GC-MS to probe five points of the beer brewing process. Samples were collected from the bright beer tank prior to conditioning, as well as at the start of fermentation, the end of fermentation, pre-boil, and post-boil.
Headspace solid phase micro-extraction (HS-SPME) was paired with GC-MS as the sampling technique used to collect and concentrate the volatile and semi-volatile analytes from the headspace prior to injection.
As they traveled through the GC column, individual analytes collected on the SPME fiber were separated from each other. Information for identification and relative quantitation was provided by MS detection.
Insight into the chemical changes occurring throughout the process can be provided by observing these changes in the aroma profile and connecting them to the steps of the brewing process.
Experimental
Figure 1 shows the various stages of the brewing process at which samples were collected (pre-boil, post boil, the start of fermentation, the end of fermentation, and from a bright tank of beer).
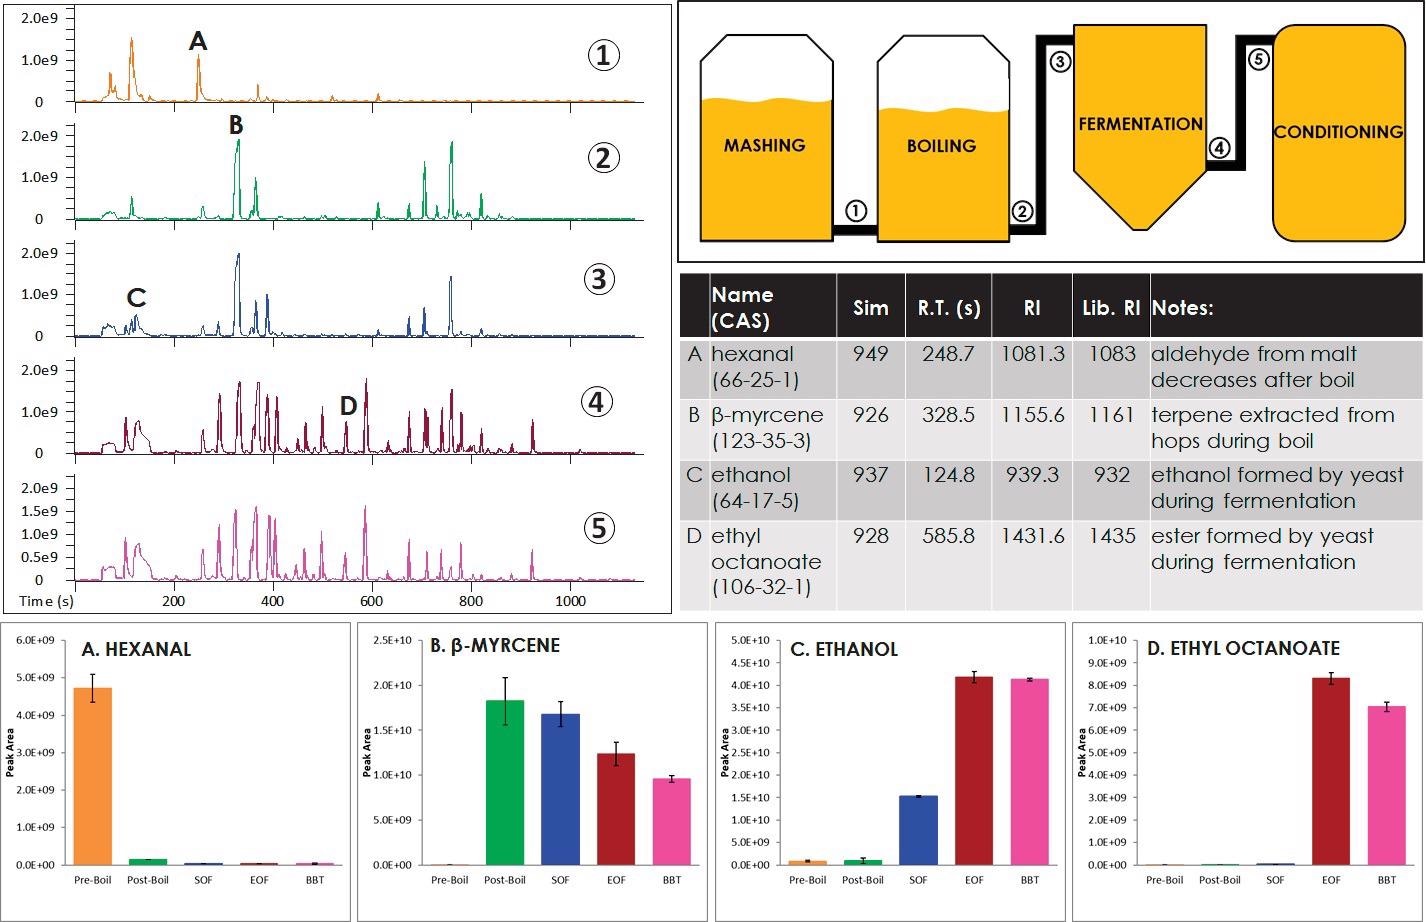
Figure 1. Various points during the brewing process (labeled 1 through 5) were monitored with GC-MS. Representative chromatograms at each processing point are shown. Example analytes that clearly changed during the brewing process are also shown (labeled A through D). Image Credit: LECO Corporation
Each sample of 5 mL was placed in a 20 mL vial and analyzed with HS-SPME coupled to LECO's Pegasus BT GC-TOFMS, using the method conditions listed in Table 1. To calculate retention indices to filter library search results, data for an alkane standard was also acquired.
Table 1. GC-TOFMS (Pegasus BT) Conditions. Source: LECO Corporation
| Autosampler |
LECO LPAL 3 |
| SPME Fiber |
DVB/CAR/PDMS fiber (conditioned 5 min pre-injection at 250 °C) |
| Incubation and Extraction |
Incubate 10 minutes and Extract 20 minutes at 35 °C |
| Gas Chromatograph |
Agilent 7890 |
| Injection |
SPME, 3 min desorption in 250 °C inlet, splitless |
| Carrier Gas |
He @ 1.4 mL/min |
| Column |
Stabilwax, 30 m x 0.25 mm i.d. x 0.25 µm coating (Restek) |
| Temperature Program |
3 min at 40 °C, ramped 10 °C/min to 250 °C, hold 1 min |
| Transfer Line |
250 °C |
| Mass Spectrometer |
LECO Pegasus BT |
| Ion Source Temperature |
250 °C |
| Mass Range |
33-500 m/z |
| Acquisition Rate |
10 spectra/s |
Results and Discussion
Figure 1 shows an outline of both the brewing process and representative chromatograms from the points at which the process was analyzed. The first sample was collected at the start of the boiling stage of the brewing process, or at “Pre-Boil.” This sample primarily consists of analytes extracted from the malt during mashing.
“Post-Boil,” or the second sample, was collected at the end of the boil, during which hops were added. There was an increase of analytes that were extracted from the hops, while other analytes that degraded or chemically changed during boiling were observed to decrease compared to the “Pre-Boil” sample.
“Start of Fermentation (SOF)” was the next sample and was taken at the start of fermentation when yeast was added. The fourth sample, “End of Fermentation (EOF),” was collected following fermentation. Yeast activity and other chemical reactions are the cause of the many changes that occur during this stage of the process.
“Bright Beer Tank (BBT),” which was the final sample, was collected after the yeast was no longer in suspension. Hundreds of analytes were detected across these samples, including aromatics, furans, ketones, aldehydes, organic alcohols, terpenoids, terpenes, esters, and nitrogen-containing and sulfur-containing analytes.
The total ion chromatograms (TIC) in Figure 1 show that many differences in the samples were readily apparent, indicating significant chemical changes over the brewing process.
Figure 1 shows information for four analytes (labeled A-D) with changes clearly visible in the TIC. Hexanal, an aldehyde from the malt, is observed at highest levels in the “Pre-Boil” sample and then decreases during the boiling stage.
β-myrcene is a terpene extracted from hops and is observed at its highest levels in the “Post-Boil” sample, then shows a gradual decline through the remaining process stages. During fermentation, after the yeast was added, ethanol, a product of yeast activity, was observed to increase.
Yeast activity is the likely cause for the increase of ethyl octanoate, an ester, during fermentation. The TIC makes these changes clearly apparent, but other important differences may be obscured by coelutions and hidden in the TIC view. Figure 2 shows an example of this.
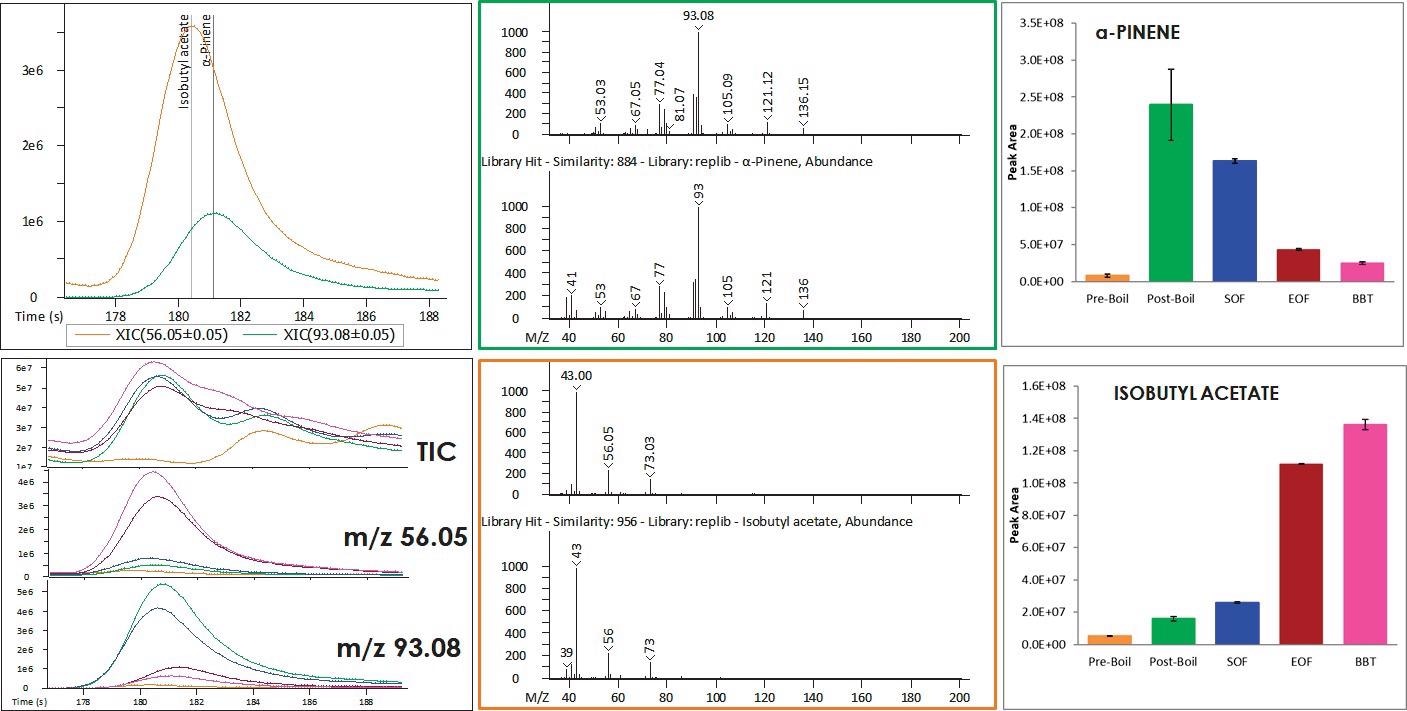
Figure 2. The trends for some analytes may be obscured by coelutions in the TIC view. In these cases, deconvolution is crucial for distinguishing analytes and their changes over the brewing process. The individual differences are not apparent in the TIC view, but deconvolution reveals that the ester increases and a terpene decreases. Image Credit: LECO Corporation
A terpene, α-pinene, and an ester, isobutyl acetate, chromatographically coelute. These analytes can be clearly distinguished by plotting extracted ion chromatograms (XICs) unique to each analyte but appear as a single peak in the TIC.
There appears to be no trend in this peak at this retention time if all samples are overlaid, but the XICs reveal that the ester increases while the terpene decreases. The deconvolution software from LECO was crucial for determining the trends of the coeluting analytes and it handled them in an automated way.
Additionally, the chemical reactions that may be occurring throughout the process can be shown by tracking specific chemicals. For example, Figure 3 describes the relationship between furfuryl ethyl ether, ethanol, furfuryl alcohol and furfural.
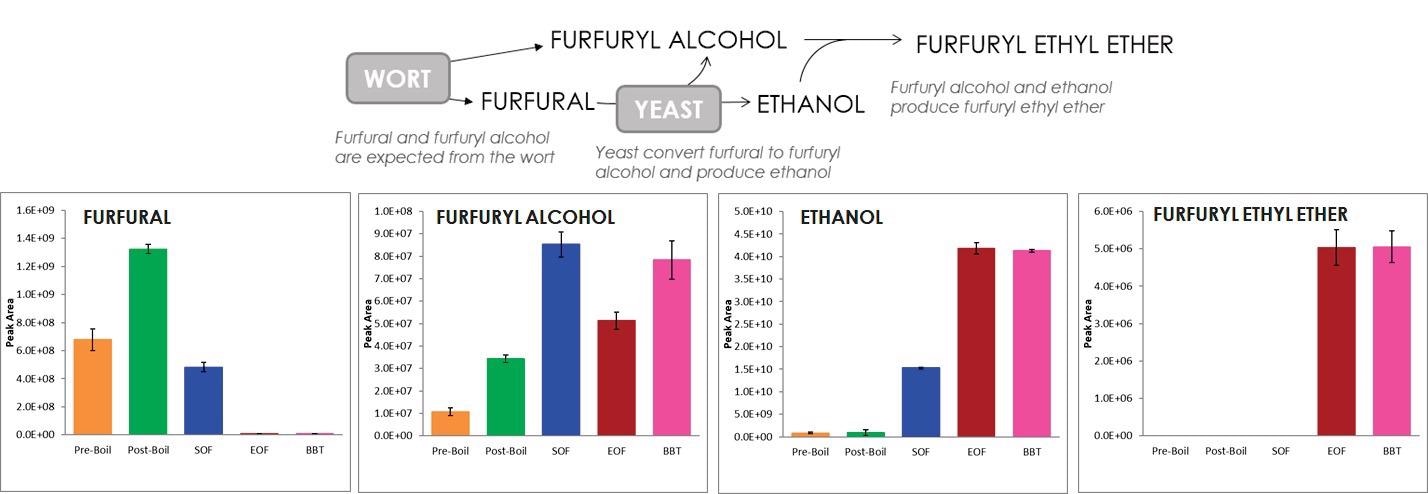
Figure 3. The relationship between furfural, furfuryl alcohol, ethanol, and furfuryl ethyl ether is described. Image Credit: LECO Corporation
Furfuryl alcohol and furfural are extracted from wort and were both observed to increase during the boil. Yeast is able to convert furfural to furfuryl alcohol, and a decrease in furfural along with an increase of furfuryl alcohol was observed at the start of fermentation after the yeast was added.
Ethanol was observed to increase at the start of fermentation, which is also produced by yeast. Furfuryl alcohol and ethanol can then react with each other to produce furfuryl ethyl ether, which was observed at the end of fermentation along with a corresponding decrease in furfuryl alcohol.
Table 2 shows these analytes and a collection of others that were observed to change during the brewing process. Mass spectral and retention index matching (observed compared to NIST library databases) was done to determine the analyte identifications.
Table 2. Identification information and relative trends (heat map) for representative analytes indicate changes over the brewing process per analyte. Source: LECO Corporation
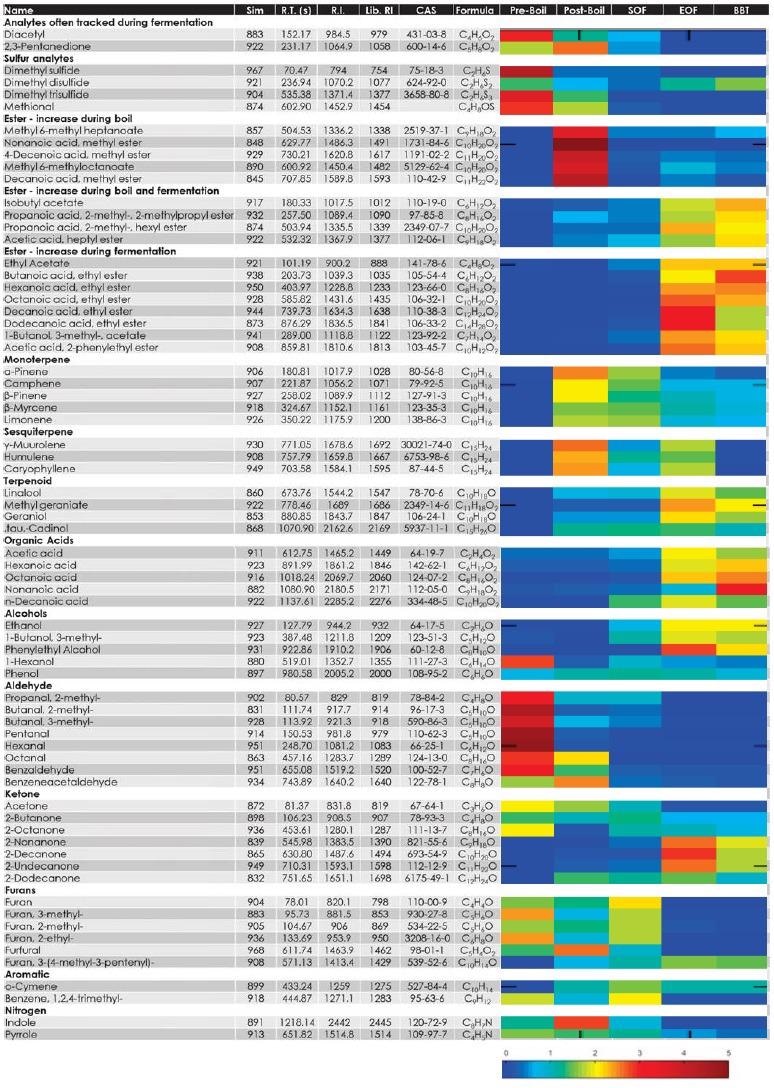
The heat map shows how the analytes changed throughout the brewing process, which is indicated by the relative peak area for each analyte at each point in the process. Different compound classes observe different behaviors, and there may be different trends for analytes within a compound class.
An example of this is the way some esters increase during fermentation while others increase during the boil. There is an increase in terpenes during the boil and then a gradual decrease throughout the rest of the process.
After fermentation is when organic acids and alcohols are most likely to appear. This kind of information can help track when various aroma contributors have reached the desired level or when specific undesired notes have dropped.
Conclusion
As raw materials are taken through various stages of the brewing process to yield the finished product, many chemical changes occur. GC-MS enables effective tracking and identification of individual chemicals for the purpose of understanding the changes the chemicals undergo during the brewing process.
This article demonstrated detection of hundreds of analytes within the chosen samples and presented information for representative analytes, revealing many observable trends.
For example, analytes from the hops were observed to increase during the boil, while some analytes from the malt decreased during the boil. There was an observation that ethanol increased during fermentation.
Some esters increased during fermentation, while some increased during the boil. Deconvolution provided better information for more analytes and was crucial in discerning chromatographic coelutions. Significant insight into the chemical changes occurring throughout the process was provided through observation of changes in the aroma profile.

This information has been sourced, reviewed and adapted from materials provided by LECO Corporation.
For more information on this source, please visit LECO Corporation.