Sponsored by PerkinElmerReviewed by Olivia FrostAug 24 2023
Paints and adhesives, despite being distinct substances serving different purposes, share a common feature: they both start as liquid-phase materials and transition into solid materials after a drying or curing period.
Adhesives can permanently join surfaces together either by mechanical or chemical bonding. Mechanical bonding is the simpler and more common form of adhesion. The bond formed between the adhesive and the surface occurs when the adhesive works its way into the tiny pores of the surface as a liquid and then begins to dry.
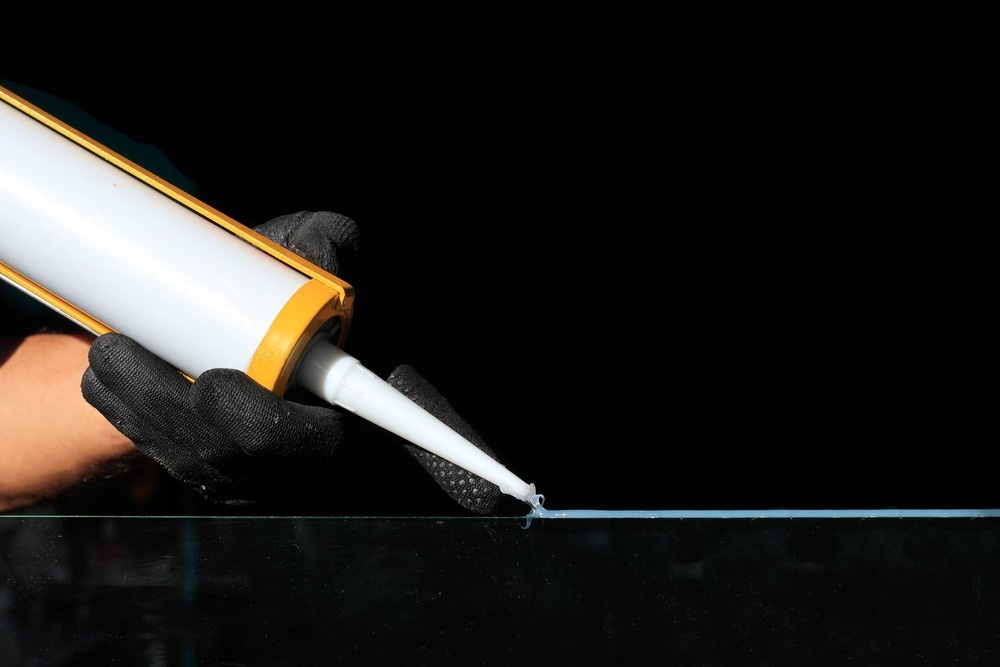
Image Credit: ShutterStock/sichkarenko.com
In contrast, chemical bonding involves a more intricate process wherein compounds are formed between the chemicals present on the two surfaces.1
There are a variety of different paints available, with the primary classifications being solvent-based or water-based, each incorporating suitable polymer systems and functional additives. The gradual evaporation of water or solvents over time facilitates the transformation of the material into a stable state, enabling it to fulfill its intended purpose.
In the realm of coatings and adhesives industries, Attenuated Total Reflectance (ATR) FTIR sampling methods find extensive application in the characterization of raw materials and product formulations.
These methods entail immediate measurements of a sample as it is placed onto the ATR crystal. This article outlines how ATR measurements can be expanded and used to monitor evolving changes as the material undergoes the drying or curing process over time.
Experimental
For this experiment, a UATR (Universal Attenuated Total Reflectance) accessory was fitted to the PerkinElmer Spectrum TwoTM (Figure 1). For time-resolved analyses, diamond or disposable silicon ATR crystal elements were selected, which will be explored later in this article.
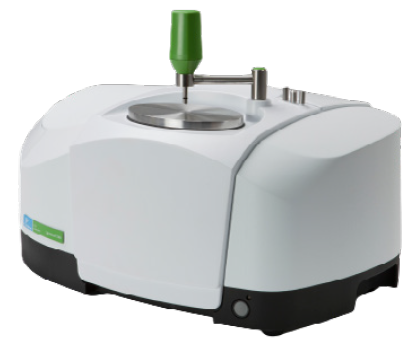
Figure 1. The Spectrum Two FTIR Spectrometer with UATR Accessory. Image Credit: PerkinElmer
To record spectra, a drop of the sample is placed onto the ATR crystal. As the sample is a liquid, perfect contact with the crystal will be achieved without having to apply the pressure arm.
A typical spectral measurement is performed over the spectral range 4000-450 cm-1 at a spectral resolution of 8 cm-1, taking approximately 10-15 seconds. ATR spectra of two paint types (acrylic and enamel) are shown in Figure 2.
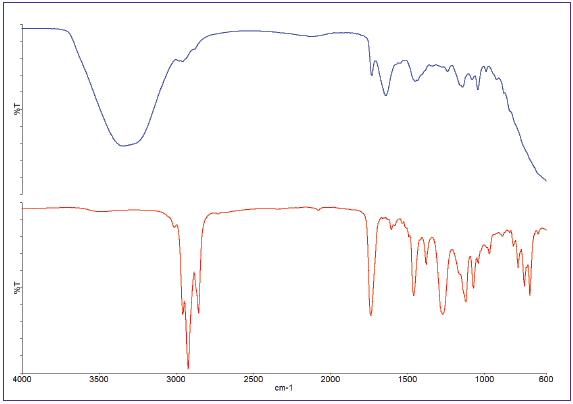
Figure 2. ATR spectra of acrylic (top) and enamel (bottom) paints. Image Credit: PerkinElmer
From this spectra, it is clear that the acrylic paint is water-based due to the presence of a broad -OH band around 3400 cm-1, but the enamel paint is solvent-based. This spectra can thus serve as quality control (QC) references for product formulation.
Time-Resolved Paint Studies
The Spectrum Timebase software facilitates consecutive spectrum acquisitions within specified time intervals. In these experiments, spectra was gathered every 10 seconds over a period of a few hours.
Changes in both spectral and chemical attributes can be revealed by comparing spectra obtained at the beginning and end of the experiment.
Figure 3 presents two spectra of a water-based paint: one captured at the outset of the time-based run (red) and the other at the conclusion (black). At the start of the experiment, the formulation’s components are dissolved in water, which is evidenced in the prominent water-related bands.
As the water evaporates over time, it becomes evident that the broad -OH band at 3400 cm-1 becomes less intense as the other materials’ concentration increases. At the end of the experiment, the water bands have virtually disappeared.
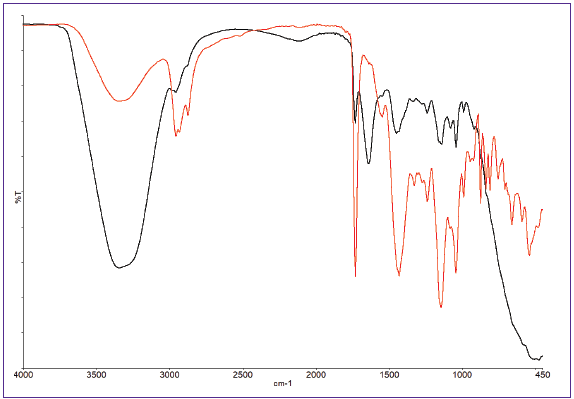
Figure 3. Spectra of water-based paint at start (black) and end (red) of run. Image Credit: PerkinElmer
Throughout the run, the software generates a Gram-Schmidt profile, offering a holistic view of the changes in the total spectral absorbance.
Additional specialized profiles can also be made to monitor specific spectral bands of interest. Such profiles indicate when spectral changes no longer occur, examples of which are shown in Figure 4 for the water and carbonyl peaks.
The profiles illustrate an initial rapid reduction in water content, followed by a deceleration with minor losses after 6000 seconds.
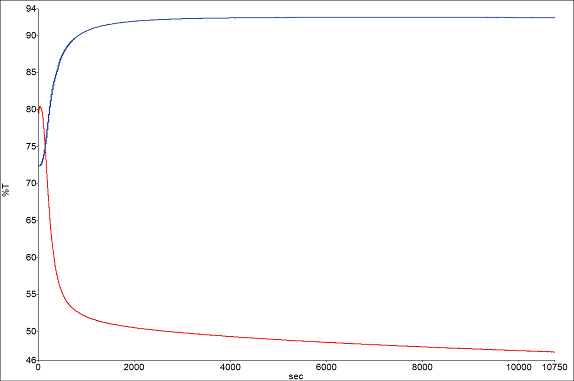
Figure 4. Band profiles for water 1640 cm-1 (blue) and carbonyl 1730 cm-1 (red). Image Credit: PerkinElmer
A parallel experiment was conducted on solvent-based paint. Spectra from the beginning and end of the study are displayed in Figure 5, demonstrating notable disparities primarily in the hydrocarbon peak (slightly below 3000 cm-1) and the carbonyl peak (around 1730 cm-1).
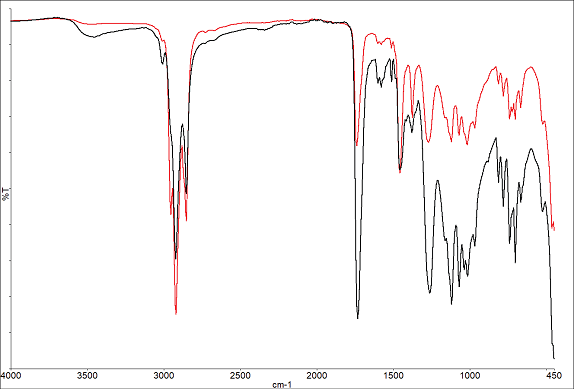
Figure 5. Spectra of Solvent based paint at start (red) and end of run (black). Image Credit: PerkinElmer
Figure 6 showcases profiles for the hydrocarbon (2955 cm-1) and carbonyl (1734 cm-1) peaks. The hydrocarbon peak diminishes as the solvent evaporates, while the carbonyl peak grows as more of the bulk materials interact with the ATR crystal. These findings are consistent with a hydrocarbon solvent being used in the formulation.
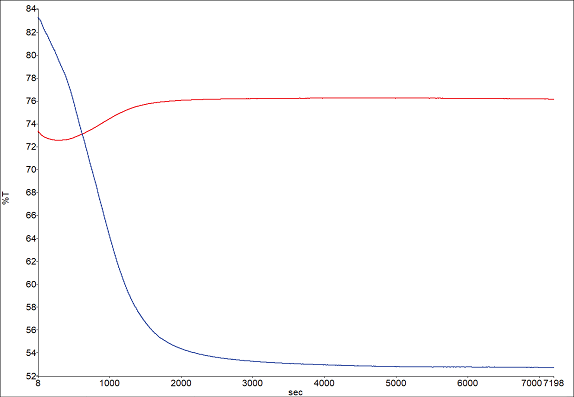
Figure 6. Band profiles for hydrocarbon 2955 cm-1 (red) and carbonyl 1734 cm-1 (blue). Image Credit: PerkinElmer
The near-complete loss of solvent seems to occur around the 5000-second mark.
Time-Resolved Adhesives Studies
Numerous adhesive types exhibit rapid curing upon exposure to atmospheric moisture, which results in robust bonds. ATR accessories enable the corresponding chemical changes to be monitored.
However, the purpose of the adhesive is to stick to surfaces, and performing these experiments on a “multi-use” ATR crystal element can require aggressive cleaning processes that have been known to cause damage to the crystal or the top ATR plate.
However, disposable silicon ATR crystals are an innovative and cost-effective methodology well-suited for these experiments.
The Specac Arrow Silicon ATR consumable slides, as depicted in Figure 7, offer a fitting solution. These slides can seamlessly integrate with the Spectrum Two UATR accessory, facilitating their application in experiments of this nature.
At the end of the investigation, once the adhesive has cured, the ATR crystal slide can be replaced with a fresh one. The old slide can then either be discarded or retained for additional measurements.
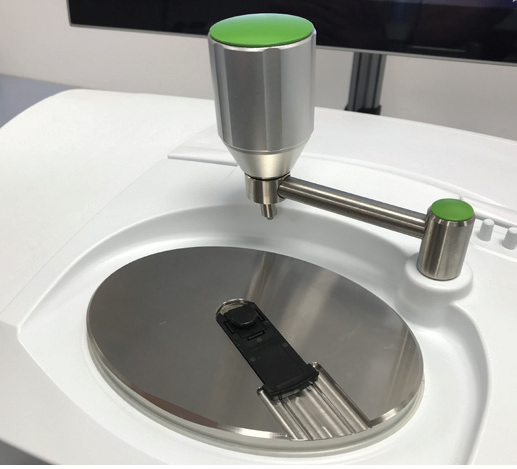
Figure 7. The Specac ArrowTM Silicon ATR crystal mounted in a Spectrum Two UATR. Image Credit: PerkinElmer
For each experiment, a single adhesive droplet was placed onto the Specac Arrow Silicon ATR crystal, and spectra were collected via the Spectrum Timebase software at an 8 cm-1 resolution over an extended timeframe.
Figures 8a and 8b showcase spectra captured at the beginning and end of the experiment, as well as during its progression. The initial spectrum identifies the adhesive as water-based.
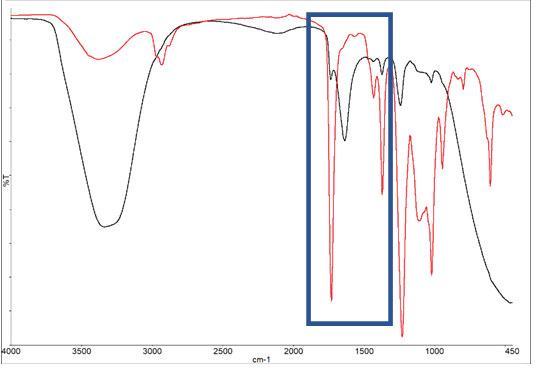
Figure 8A. Spectra of adhesive at the start of the experiment (black) and end of the experiment (red). Image Credit: PerkinElmer
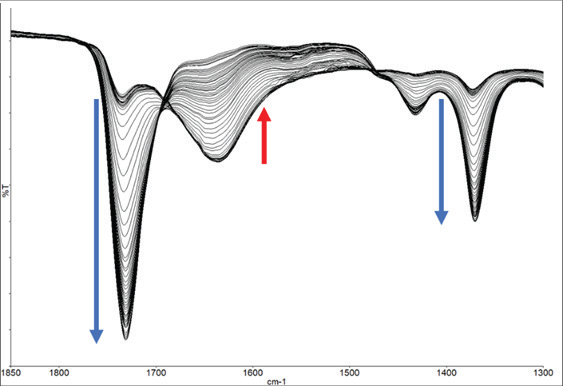
Figure 8b. Expanded region showing increase and decrease of spectral bands during the experiment. Image Credit: PerkinElmer
The substantial OH peak, situated just below 3500 cm-1, exhibits a marked decrease, signaling the evaporation of water and the material’s solidification. The intensity plots for the water band and the polymer system are depicted in Figure 9.
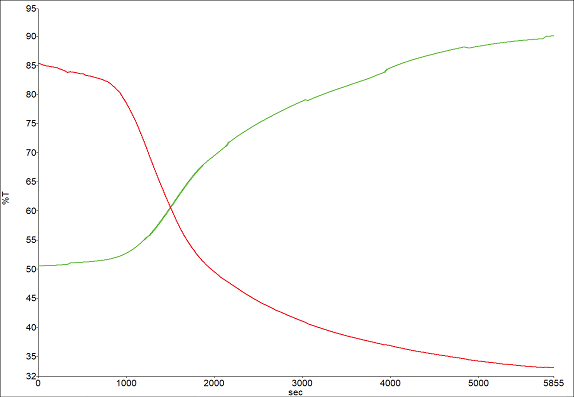
Figure 9. Band profiles for -OH 3400 cm-1 (green) and carbonyl 1734 cm-1 (red). Image Credit: PerkinElmer
This dataset unmistakably illustrates that, even after 100 minutes, the adhesive has not yet achieved complete curing, despite the material feeling rather solid.
Conclusion
Monitoring the drying and curing processes of paints and adhesives through FTIR is relatively quick and straightforward and requires minimal sample preparation.
The disposable ATR crystals allow for the low-cost analysis of even some of the strongest adhesives, which would be extremely difficult to remove and could result in damage to the ATR.
These experiments can readily be expanded to investigate how the curing rates of paints and adhesives are influenced by diverse environmental factors, including temperature and humidity conditions.
References
- Permabond, https://www.permabond.com/resource-center/in-english-doc-how-do-adhesives-work/, (accessed June 22, 2022).

This information has been sourced, reviewed and adapted from materials provided by PerkinElmer.
For more information on this source, please visit PerkinElmer.