MEMS sensors have proven useful in a wide range of applications, including aviation, automotive, and data storage. This article analyzes the full dynamical behavior of a conventional MEMS device in the early 2000s to highlight the capabilities of optical measurement technology.
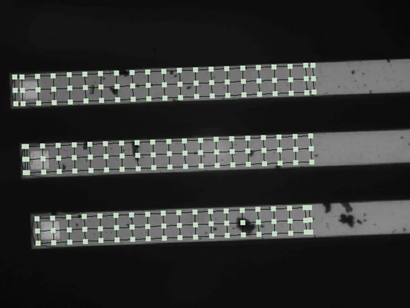
Image Credit: Polytec
The MMA was a hybrid measurement system developed by Polytec in the early twenty-first century. Stroboscopic video microscopy was incorporated into the well-known, microscope-based Laser Scanning Doppler Vibrometry (SLDV) for in-plane examination.
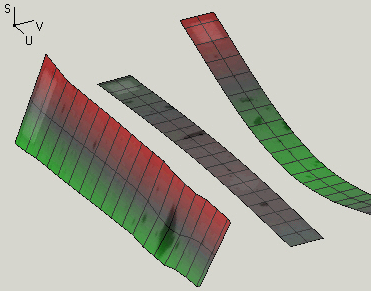
Image Credit: Polytec
The SLDV's remarkable capabilities for frequency response and operating deflection shape measurements in the out-of-plane direction were extended to full three-dimensional motion analysis.
Introduction
The device tested in this study had a standard cantilever construction, as used in airbag sensors. The features of such cantilevers were tweaked to produce isolated resonance frequencies.
Each cantilever had a unique geometry: accordingly, resonance occurred only when a single lever's specific resonance frequency was aroused. Because the sensor was passive, it was installed on a piezoelectric exciter that connected to the MMA's internal HF signal generator.
Measurement Setup
As shown in Figure 3, the specimen was placed under a conventional microscope. To assess the exciter's out-of-plane response, a "pseudo-random" broadband signal was applied.
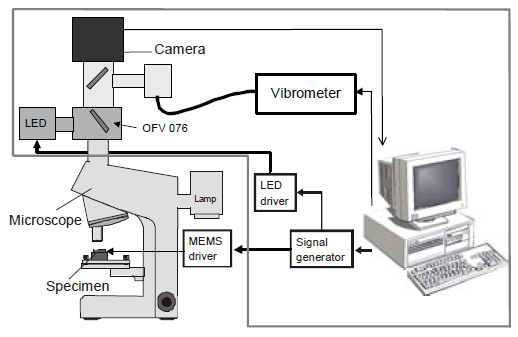
Figure 3. Polytec MMA system. Image Credit: Polytec
A HeNe laser beam was coupled into the microscope's optical path and focused onto the specimen. Any surface vibration altered the frequency of reflected laser light (FM modulation; Doppler effect).
The interference signal from a Mach-Zehnder interferometer can be demodulated to produce an output signal proportional to the velocity vector normal to the measurement surface (out-of-plane measurement). To get the operational deflection shapes (ODS), the laser beam scanned the surface point by point using two piezo-driven mirrors.
The generator signal was looped back into the acquisition channel, forming the reference phase.
To address the limitations of out-of-plane analysis, the final MMA system included a strobe unit with a flash LED and a high-resolution, progressive-scan digital camera to record the specimens' in-plane movements. The LED and camera were synced with the excitation source.
Out-of-Plane Analysis
Figure 1 shows a live video image from a progressive scan camera. The researchers limited the analysis to three cantilevers, although the sample contained over thirty. The scanpoint grid for each lever was quickly defined using a freehand tool on the video image.
Density was selected to provide 180 scan points on a rectangular grid (Figure 1). A measurement with a bandwidth of 100 kHz was then taken point-by-point. Figure 4 shows the average frequency response function (FRF).
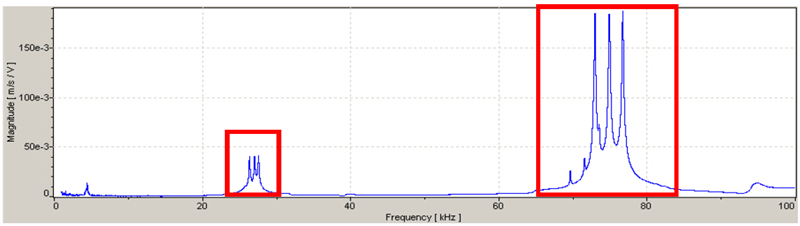
Figure 4. Averaged FRF, 100 kHz BW. Image Credit: Polytec
The spectrum is the average of all 180 scan points. A 3200 FFT-line analysis yielded a frequency resolution of 31.25 Hz and a total measurement duration of around 20 seconds for the entire structure, including complex averaging.
As expected, the researchers discovered two resonance triplets, one around 27 kHz and the other around 75 kHz, which correspond to two orders of bending modes for the three cantilevers.
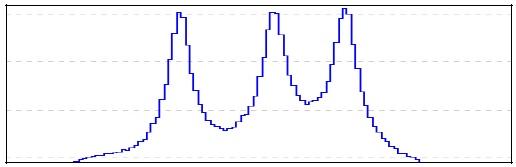
Figure 5. Triplet around 27 kHz. Image Credit: Polytec
First, the researchers looked at the ODS of the 27 kHz triplet (Figure 5). The resonances occurred at 26.3 kHz, 27.1 kHz, and 27.6 kHz, with displacement amplitudes of approximately ± 1.5 nm. Figures 6, 7, and 8 show the various deflection modes. The red tint represents maximum elongation, whereas the pale green color denotes a knot.
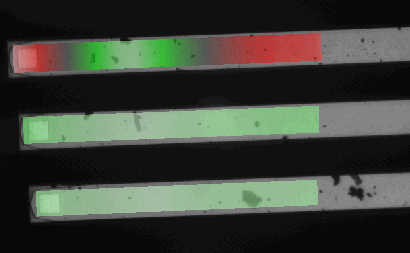
Figure 6. ODS at 26.31 kHz. Image Credit: Polytec
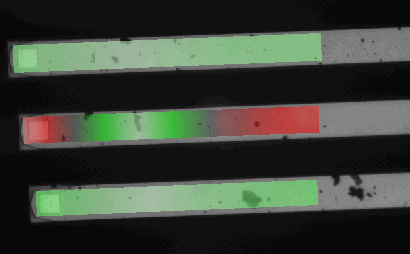
Figure 7. ODS at 27.09 kHz. Image Credit: Polytec
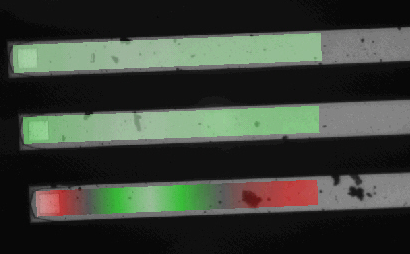
Figure 8. ODS at 27.59 kHz. Image Credit: Polytec
These findings are particularly relevant for validating resonances derived using finite element models (FEM). However, the resonant triplet at 75 kHz exposes some unique characteristics (Figure 9).
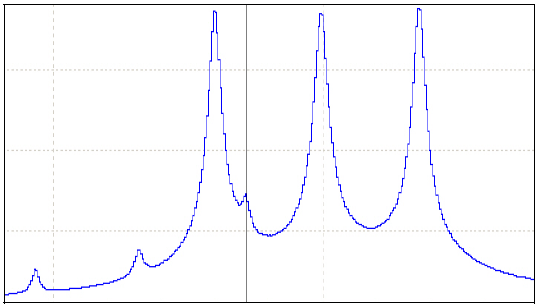
Figure 9. Triplet around 75 kHz. Image Credit: Polytec
The researchers discovered a higher-order bending mode triplet with displacement amplitudes of ± 20 nm. The appropriate ODS are shown in Figures 10, 11, and 12.
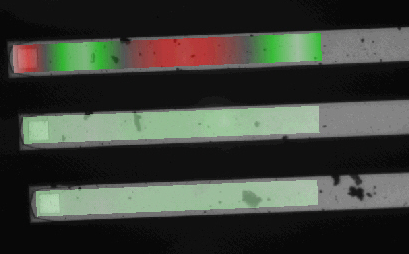
Figure 10. ODS at 72.97 kHz. Image Credit: Polytec
Aside from these higher-order bending modes, the FRF spectrum in Figure 9 shows a superposed third triplet of lower amplitude. Figure 13 shows the first resonance of the third triplet, which reveals a tilt motion of the first cantilever at 69.7 kHz.
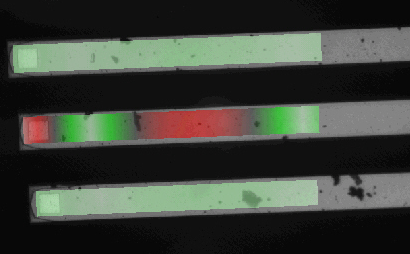
Figure 11. ODS at 74.94 kHz. Image Credit: Polytec
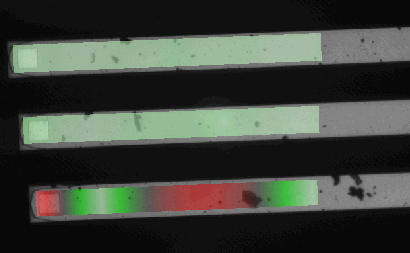
Figure 12. ODS at 76.78 kHz. Image Credit: Polytec
The two resonances at 71.53 kHz and 73.56 kHz indicate the tilting of the second and third cantilevers, respectively. Figure 2 shows a picture of the 3D ODS animation of the third tilt mode (± two nanometers).
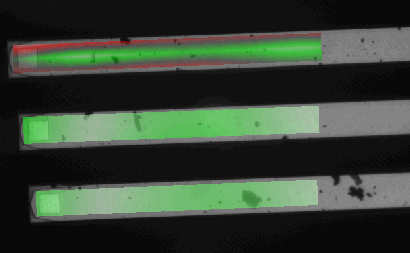
Figure 13. ODS at 69.66 kHz. Image Credit: Polytec
According to the researchers, the tilting of the three cantilevers corresponds to a combined in- and out-of-plane mode.
A rotating movement, for example, with 90 ° phase shift between in- and out-of-plane motions, might appear as such a tilting in an out-of-plane measurement. As a result, the researchers selected the 73.56 kHz resonance for in-plane study using strobe video.
In-Plane Analysis
In contrast to SLDV systems, broadband excitation is achievable only with repeated hammer blows. The researchers used sinusoidal excitation and frequency stepping: for each frequency, N images were recorded at different phase angles ranging from 0 ° to 360 °.
Synchronizing the flash LED, CCD camera, and excitation signal enables recording several thousand flashes at the same phase during a single camera exposure. Thus, frequencies up to one MHz can be studied using at least 10 shots (phases) every period.
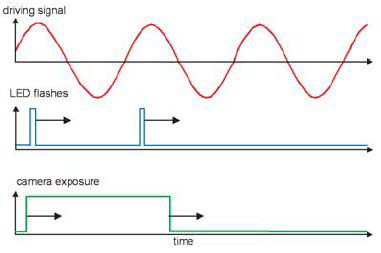
Figure 14. Principle of strobe video. Image Credit: Polytec
For this example, the researchers recorded images at frequencies ranging from 72.5 to 75 kHz with 50 Hz steps, recording 16 photographs per period and frequency, yielding a total of 800 images to be examined. The acquisition took approximately two minutes.
To reduce calculation time, a small template (red box in Figure 15) of the moving structure in the image was selected, as was a region-of-interest (ROI, green box in Figure 15). Image-image correlation techniques determined the displacement (δx, δy) for each phase.
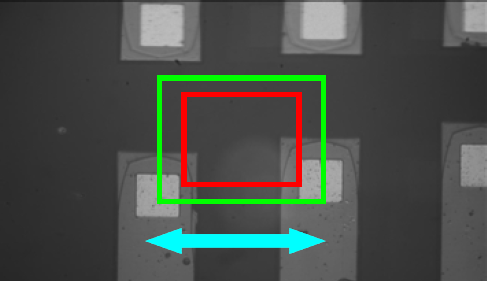
Figure 15. Image-template and ROI. Image Credit: Polytec
This approach determines position shifts with a noise level of less than 0.03 pixel, or four nm resolution when using a 50x objective. The results are presented in Bode graphs (Figures 16 and 17).
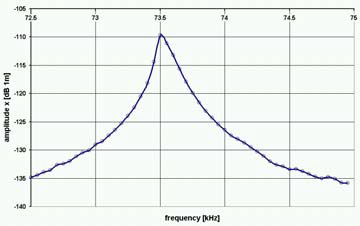
Figure 16. Bode-plot of δx-Amplitude. Image Credit: Polytec
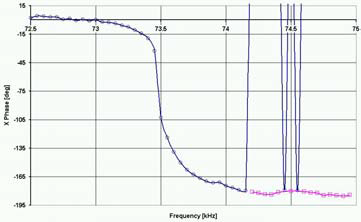
Figure 17. Bode-plot of δx-Phase. Image Credit: Polytec
The trajectory analysis reveals a sinusoidal in-plane motion with 6.5 µm peak-to-peak amplitude. The results match the previous out-of-plane analysis (± two nm amplitude), highlighting the importance of a hybrid system for 3D motion analysis on MEMS structures.
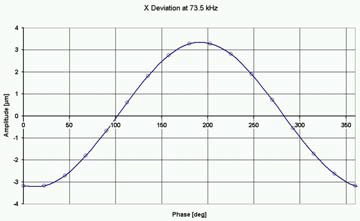
Figure 18. Trajectory-plot of δx. Image Credit: Polytec
Conclusion
Microscope-based SLDV enables ultra-precise (MHz movements with picometer precision) and rapid detection of all out-of-plane resonances.
The high sensitivity detected residual motion from in-plane modes. Thus, in-plane analysis could be performed ‘right on the spot’, saving time and data from imaging analysis and broadband technical sine-stepping.

This information has been sourced, reviewed, and adapted from materials provided by Polytec.
For more information on this source, please visit Polytec.