Permanent magnets see widespread use in multiple applications and devices within the sustainable energy solutions and everyday consumer goods sectors.
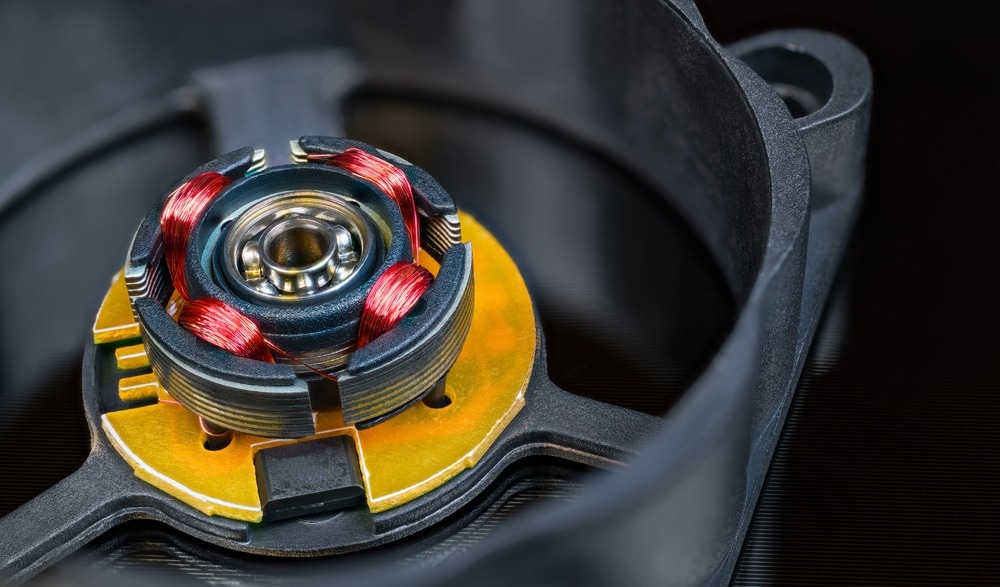
Image Credit: KPixMining/Shutterstock.com
Currently, they serve as essential components in electric generators for wind turbines, electric vehicle motors, tools, energy-efficient lighting, mobile phones, hard drives, and flat-screen televisions.
Their utility further extends to medical imaging equipment (MRI) and even playful magnetic toys.
At present, neodymium (Nd) magnets stand out as the most potent type of commercially obtainable magnets, exhibiting superior performance over conventional magnetic materials like AlNiCo and ferrite magnets.
Furthermore, neodymium magnets offer a more economical option when contrasted with other rare earth element (REE) based magnets, such as samarium-cobalt compounds.
Neodymium magnets are primarily alloys of neodymium, iron (Fe), and boron (B), typically forming the Nd2Fe14B structure.
Additives such as dysprosium (Dy), terbium (Tb), or other REEs are frequently incorporated to elevate the Curie temperature. This is the temperature at which a magnetic compound relinquishes its ferromagnetic characteristics, which thereby enables high-temperature applications for this magnet type.
The resultant Curie temperature, and consequently, the magnetic properties at elevated temperatures, are significantly influenced by the quantities and proportions of these REE additives.
Neodymium magnets are prone to degradation to corrosion when exposed to humid, caustic, or acidic environments. Consequently, protective metallic coatings, such as nickel (Ni) or nickel-copper (Ni-Cu) layers, are applied through an electroplating process.
The thickness of these applied layers directly correlates with the corrosion resistance of the entire magnet assembly.
The constituents of the primary components (neodymium, iron, and boron), the additives (dysprosium, terbium, REEs), and the base metals of the protective coating dictate the magnetic characteristics and corrosion resilience, and thus the suitability of the magnets. Therefore, rigorous quality assurance is a mandatory part of the manufacturing procedure.
In this context, spectroscopic techniques, including optical emission spectroscopy using inductively coupled plasma (ICP-OES), provide an excellent means to examine major elemental constituents within the percentage range, alongside minute quantities of additives and impurities down to the sub mg/kg level.
REEs and transition metals are notoriously known for generating extremely line-dense spectra, presenting a substantial risk of spectral overlap on the most prominent analyte wavelengths. High concentrations of iron, neodymium, dysprosium, and terbium give rise to thousands of intensely visible emission lines.
This complex spectral landscape necessitates the use of a high-resolution spectrometer to resolve significant interferences and permit the use of sensitive emission lines for the determination of trace quantities.
Moreover, a robust plasma system is essential to accommodate minimal dilution factors for digested samples. In conjunction with high inherent sensitivity, this configuration facilitates optimal analytical outcomes across both trace and major concentration levels.
In this regard, the PlasmaQuant 9200 Elite, a high-resolution ICP-OES array, delivers multiple benefits.
These include: an industry-leading spectral resolution of 2 pm @ 200 nm for resolving even the most severe spectral interferences; a highly stable plasma and torch system capable of handling highly concentrated sample aliquots; and exceptional sensitivity to achieve detection limits in the sub mg/kg range for highly demanding sample types like REE magnets.
Materials and Methods
Sample Preparation
Approximately 0.2 g of the sample was weighed, then transferred into a heat-resistant 50 mL polypropylene tube, and 4 mL of deionized water was added. Subsequently, 4 mL of HNO3 (w ≥ 65 %) was gradually added to this mixture.
Following this, heating was applied (90 °C for two hours) using a HotBlock™. After cooling to ambient temperature, samples were diluted to 50 mL with deionized water and analyzed directly. The quantification of cerium (Ce), iron (Fe), gadolinium (Gd), neodymium (Nd), and praseodymium (Pr) was performed after a 100-fold dilution.
Instrument Settings
The analysis was undertaken using a PlasmaQuant 9200 Elite ICP-OES. The instrument was equipped with its standard kit: a glass concentric nebulizer (1.0 mL/min); a cyclonic spray chamber; a 2 mm ID injector tube; PVC tubing; and a Teledyne Cetac ASX 560 autosampler.
Table 1. Instrument settings. Source: Analytik Jena
| Parameter |
|
Specification |
| Plasma power |
|
1300 W |
| Plasma gas flow |
|
9 L/min |
| Auxiliary gas flow |
|
0.4 L/min |
| Nebulizer gas flow |
|
0.6 L/min |
| Nebulizer |
Concentric, 1.0 mL/min, Borosilicate |
| Spray chamber |
Cyclonic spray chamber, 50 mL, Borosilicate |
| Outer tube/Inner tube |
Quartz/quartz |
| Injector |
Quartz, ID: 2 mm |
| Pump tubing |
PVC (black, black) |
| Sample pump rate |
1.0 mL/min |
| Delay time |
45 seconds |
Table 2. Method parameters. Source: Analytik Jena
| Element |
Line [nm] |
Plasma view |
Integration mode |
Read time [s] |
Evaluation |
| No. of pixel |
Baseline fit |
Polyn. degree |
Correction |
| Al |
396.152 |
radial |
peak |
3 |
3 |
ABC1 |
auto |
- |
| B |
249.773 |
radial |
peak |
3 |
3 |
ABC |
auto |
- |
| Ce |
413.380 |
axial |
peak |
3 |
3 |
ABC |
auto |
- |
| Cu |
324.754 |
radial |
peak |
3 |
3 |
ABC |
auto |
- |
| Dy |
353.602 |
axial |
peak |
3 |
3 |
ABC |
auto |
CSI2 |
| Fe |
259.940 |
radial |
peak |
3 |
3 |
ABC |
auto |
- |
| Ga |
294.364 |
axial |
peak |
3 |
3 |
ABC |
auto |
CSI |
| Gd |
342.247 |
axial |
peak |
3 |
3 |
ABC |
auto |
- |
| La |
333.749 |
axial |
peak |
3 |
3 |
ABC |
auto |
CSI |
| Nb |
316.340 |
axial |
peak |
3 |
3 |
ABC |
auto |
- |
| Nd |
401.225 |
axial |
peak |
3 |
3 |
ABC |
auto |
- |
| Ni |
231.604 |
axial |
peak |
3 |
3 |
ABC |
auto |
- |
| Pr |
525.973 |
axial |
peak |
3 |
3 |
ABC |
auto |
- |
| Pt |
265.945 |
axial |
peak |
3 |
3 |
ABC |
auto |
- |
1 ... Automated Baseline Correction
2 ... Correction of Spectral Interferences
Calibration
Calibration was executed using matrix-matched standards. To achieve this, 8 % ((v/v), representing 4 mL of HNO3 (w ≥ 65 %) in 50 mL of deionized water) HNO3 was spiked with multi-element (Merck IV, 1000 mg/L; Table Mix 2, Sigma Aldrich, 10 mg/L; REE Mix, Sigma Aldrich, 50 mg/L) and single-element (Ga, Merck IV, 1000 mg/L) standards to generate the specified calibration standards (refer to Table 3).
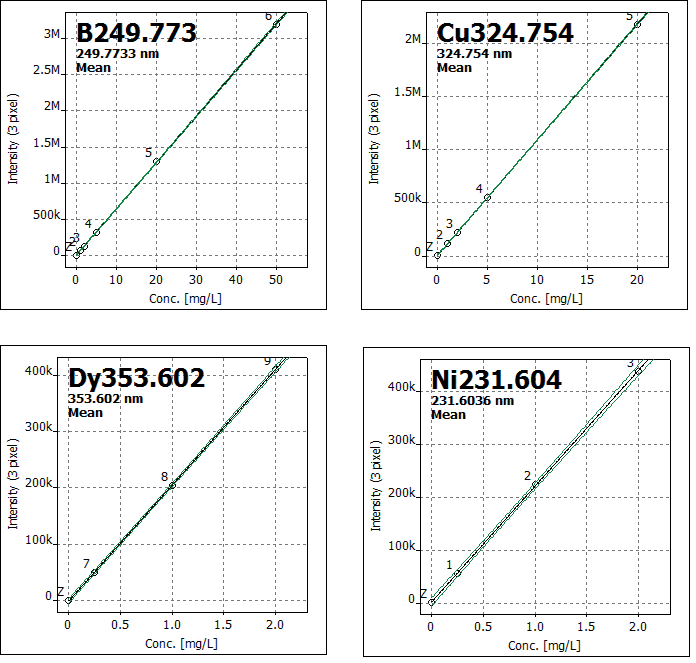
Figure 1. Selection of representative calibration functions for boron, copper, dysprosium, and nickel. Image Credit: Analytik Jena
Table 3. Concentration of calibration standards. Source: Analytik Jena
| Element |
Unit |
Cal. 0 |
Std. 1 |
Std. 2 |
Std. 3 |
Std. 4 |
Std. 5 |
| Al |
mg/L |
0 |
1.0 |
2.0 |
5.0 |
20 |
50 |
| B |
mg/L |
0 |
1.0 |
2.0 |
5.0 |
20 |
50 |
| Ce |
mg/L |
0 |
1.0 |
2.0 |
5.0 |
- |
- |
| Cu |
mg/L |
0 |
1.0 |
2.0 |
5.0 |
20 |
- |
| Dy |
mg/L |
0 |
0.25 |
1.0 |
2.0 |
- |
- |
| Fe |
mg/L |
0 |
5.0 |
20 |
50 |
- |
- |
| Ga |
mg/L |
0 |
0.1 |
0.2 |
0.5 |
- |
- |
| Gd |
mg/L |
0 |
0.25 |
1.0 |
2.0 |
- |
- |
| La |
mg/L |
0 |
0.25 |
1.0 |
2.0 |
- |
- |
| Nb |
mg/L |
0 |
0.1 |
0.2 |
0.5 |
- |
- |
| Nd |
mg/L |
0 |
1.0 |
2.0 |
5.0 |
- |
- |
| Ni |
mg/L |
0 |
0.25 |
1.0 |
2.0 |
- |
- |
| Pr |
mg/L |
0 |
0.25 |
1.0 |
2.0 |
- |
- |
| Pt |
mg/L |
0 |
0.1 |
0.2 |
0.5 |
- |
- |
Results and Discussion
For the majority of the examined analytes, spectral interferences were successfully mitigated by the superior spectral resolution of the employed ICP-OES instrument.
Figure 2 illustrates examples of neodymium and boron, where potentially overlapping peaks situated in close proximity to the analyte signal are optimally resolved to enable accurate quantification.
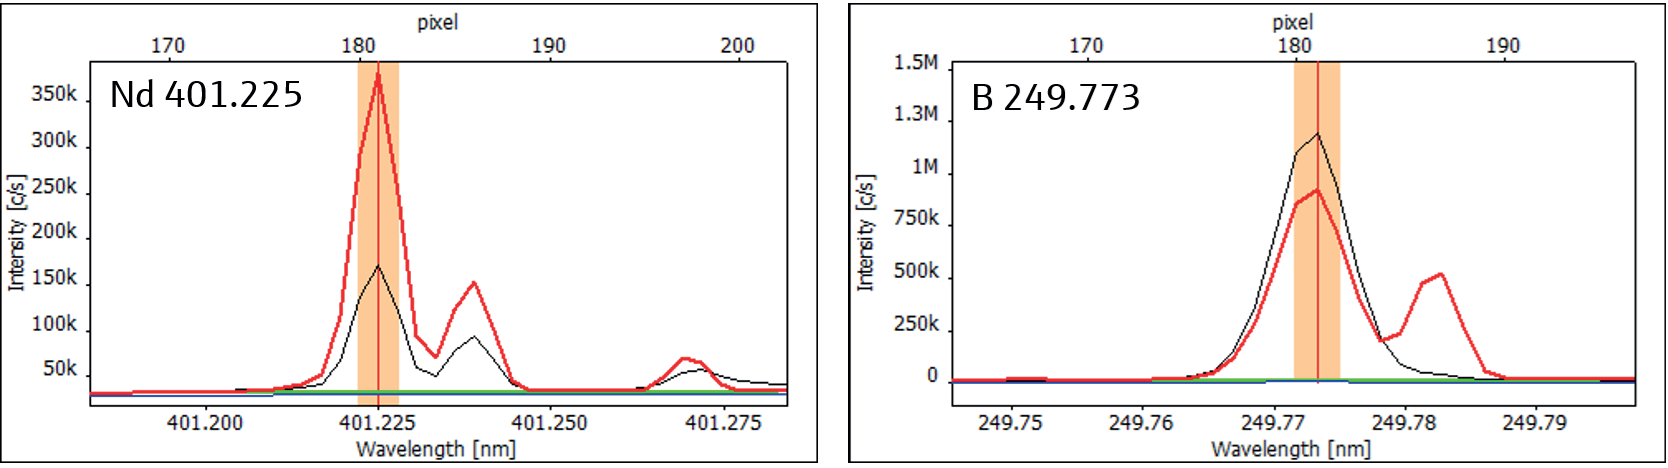
Figure 2. High-resolution spectra of Nd 401.225 (left) and B 249.773 (right) showing sufficient spacing to potentially interfering peaks (red: sample, black: calibration standard, blue: Cal. 0, green: ABC). Image Credit: Analytik Jena
Despite the instrument's high resolution, sensitive emission lines for dysprosium, gallium (Ga), and lanthanum (La) could not be adequately separated within the intricate matrix of neodymium magnets.
For these specific lines, spectral correction was implemented using a spectrum of the pure interfering element. The correction spectra were obtained by measuring dilutions of single-element standards (e.g., Ce 400 mg/L, Nd 500 mg/L) at the relevant analytical wavelength requiring correction.
Figure 3 presents an example of the dysprosium line at 253.602 nm. Through the application of the CSI algorithm for spectral correction, this highly sensitive line becomes amenable to quantification.
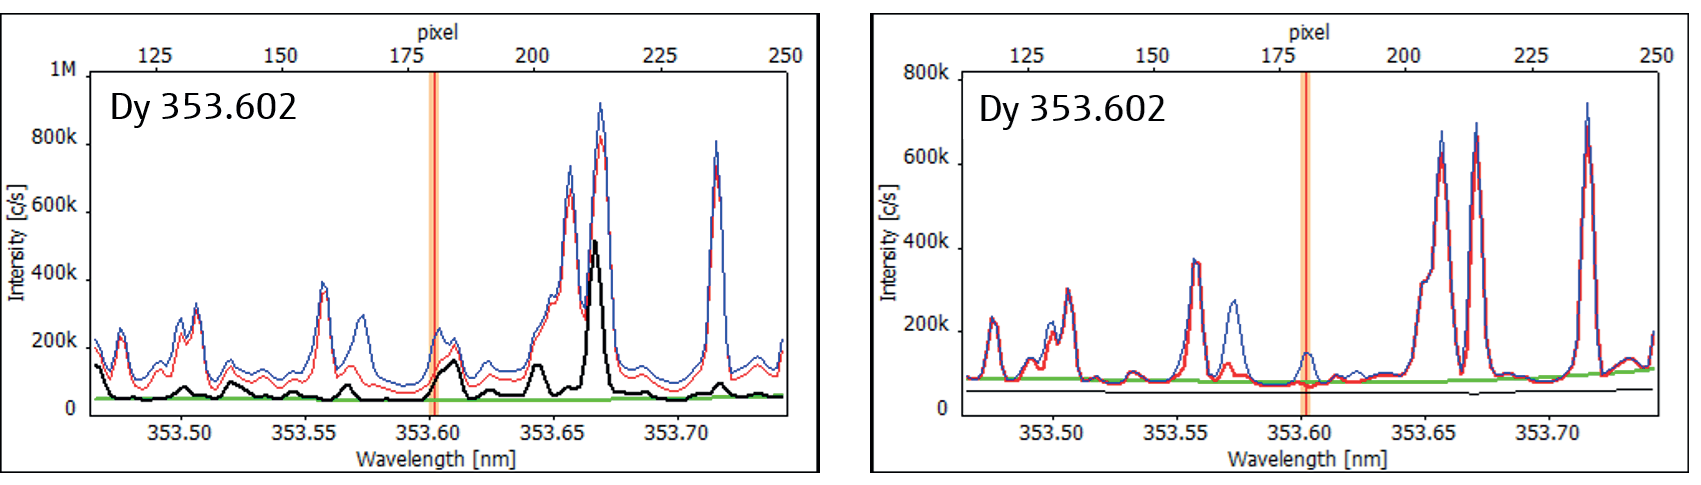
Figure 3. High-resolution spectra of Dy 353.602 as recorded (left) and CSI corrected (right) showing (red: sample, black: Nd correction spectrum (500 mg/L), blue: 1 mg/L spike, green: ABC). Image Credit: Analytik Jena
The analyzed samples were prepared and measured in duplicate to confirm the reproducibility of the implemented methodology. The precision of individual measurements is below 1.5 % RSD, while the precision of duplicate measurements falls below 3 % RSD. All findings are presented in Table 4.
The capability to detect low to sub µg/L concentrations in the measurement solutions translates to method detection limits in the sub mg/kg range for all analyzed elements.
The accuracy of the method was validated through recovery assessments of 1 mg/L spikes added to the measurement solutions. As depicted in Table 5, all investigated elements exhibited recovery values ranging from 95 % to 110 %.
Table 4. Results of Nd magnet sample. Source: Analytik Jena
| Element |
Mass fraction 1 |
RSD+ |
Mass fraction 2 |
RSD+ |
IDL* |
MDL |
| [mg/kg] |
[%] |
[mg/kg] |
% |
[μg/L] |
[mg/kg] |
| Al |
8603 |
0.8 |
8236 |
0.1 |
3.57 |
0.89 |
| B |
9739 |
1.0 |
9428 |
0.5 |
1.53 |
0.38 |
| Ce |
102,900 |
1.2 |
99,490 |
0.9 |
1.09 |
0.27 |
| Cu |
1473 |
0.2 |
1403 |
1.3 |
1.45 |
0.36 |
| Dy |
< LOD |
n.a. |
< LOD |
n.a. |
0.97 |
0.24 |
| Fe |
669,000 |
0.6 |
660,600 |
0.6 |
1.36 |
0.34 |
| Ga |
< LOD |
n.a. |
< LOD |
n.a. |
3.41 |
0.85 |
| Gd |
37,600 |
0.3 |
36,410 |
0.2 |
0.28 |
0.07 |
| La |
< LOD |
n.a. |
< LOD |
n.a. |
0.10 |
0.03 |
| Nb |
< LOD |
n.a. |
< LOD |
n.a. |
0.41 |
0.10 |
| Nd |
129,900 |
1.5 |
125,300 |
1.3 |
0.77 |
0.19 |
| Ni |
201 |
0.8 |
202 |
0.2 |
0.44 |
0.11 |
| Pr |
40,470 |
0.7 |
40,070 |
0.6 |
1.95 |
0.49 |
| Pt |
< LOD |
n.a. |
< LOD |
n.a. |
2.37 |
0.59 |
LOD refers to the limit of detection
* Instrumental limit of detection determined in 8 % (v/v) HNO3
# Method limit of detection refers to 0.2 g sample in 50 mL
+ Relative standard deviation obtained from three replicate measurements
Table 5. Method-specific spike 1 (mg/L) recovery rates for exemplary elements in undiluted sample matrix. Source: Analytik Jena
| Element |
Line [nm] |
Recovery rate [%] |
| Cu |
324.754 |
97 |
| Dy |
353.602 |
102 |
| Ga |
294.364 |
110 |
| La |
333.749 |
95 |
| Ni |
231.604 |
98 |
Summary
It is widely acknowledged that neodymium and iron produce spectra characterized by numerous emission lines and significant baseline noise.
Furthermore, the sample matrix of Nd magnets contains substantial concentrations of other REEs (e.g., Ce) and transition metals, resulting in highly complex spectra with a considerable risk of spectral interferences for most of the considered analytical wavelengths.
Typically, matrix matching is advised for calibration to address these challenges. This requires high-purity standards or reference materials for all elements targeted for determination. Given that the availability of such materials is often limited, the analysis of Nd magnets presents considerable difficulties.
One approach to overcome these limitations involves employing high-resolution instruments capable of distinguishing spectral interferences from the desired analytical signal.
The results presented herein unequivocally demonstrate the substantial practical advantages derived from the superior resolution (2 pm @ 200 nm) of the PlasmaQuant 9200 Elite system.
Its elevated sensitivity and capacity to leverage the most potent emission lines without spectral overlap enable highly accurate and precise outcomes, along with low detection limits in the sub mg/kg range for all investigated analytes.
Additionally, the automated baseline correction (ABC) software feature streamlines data processing and simplifies analytical complexity.
Another strategy for handling materials known for their profusion of emission lines and intricate interferences is to use software tools designed for spectral interference correction (CSI).
Figure 4. PlasmaQuant 9200 Elite. Image Credit: Analytik Jena
With the assistance of the CSI software tool, it becomes possible to subtract one or more unsmoothed correction spectra from interfering elements. This leads to more precise data for trace element determination.
The PlasmaQuant 9200 Elite is an ideal instrument for the quality assurance of permanent magnet alloys, such as Nd magnets.
Its high resolution, superior sensitivity, and advanced software capabilities facilitate the straightforward determination of both major and trace elements in REE- and Fe-rich materials.
Recommended Device Configuration
Table 6. Overview of devices, accessories, and consumables. Source: Analytik Jena
| Article |
Article number |
Description |
| PlasmaQuant 9200 Elite |
818-09201-2 |
High resolution ICP-OES |
STANDARD KIT for
PlasmaQuant 9x00 series |
810-88006-0 |
Sample introduction kit for aqueous samples |
| Teledyne Cetac ASX-560 |
810-88015-0 |
Autosampler with integrated rinse function |

This information has been sourced, reviewed and adapted from materials provided by Analytik Jena.
For more information on this source, please visit Analytik Jena.