In order to demonstrate the effectiveness of the FluidScan handheld condition based maintenance system for measuring lubricant physical properties, several initiatives were undertaken to compare results obtained from the FluidScan to those obtained by independent laboratory techniques. This application note is one in a series that demonstrate FluidScan's ability to analyze in-service lubricant physical properties as required by an effective predictive maintenance program.
FluidScan's ability to determine lubricant mix-ups is the subject of this application note. Two sceneries were tested, first hydraulic oil mixed with lubricating oil and second, petroleum based hydraulic oil mixed with synthetic hydraulic oil. The test results show that the FluidScan has the capability of detecting lubricant mix-ups even when a small quantity of foreign fluid is introduced into a reservoir.
FluidScan - Handheld Maintenance System
The FluidScan is a handheld condition based maintenance system that protects machinery by determining when a lubricant needs to be changed due to excessive contamination or degradation. Its detection capabilities can determine lubrication contamination, degradation and cross contamination at the point of use by measuring key oil condition parameters in both synthetic and petroleum-based lubricants and fluids. The FluidScan uses a new innovative and patented flip-top sampling cell.
The FluidScan analyzes lubricants and fluids using infrared spectroscopy, a technique that has found wide acceptance as a primary test for contamination and degradation. It performs the analyses with similar accuracy to laboratory instruments, but does so on-site as a handheld device.
Why Analyze In-Service Oil for Lubricant Mix-Up?
A serious recurring problem during maintenance procedures is the use of an incorrect lubricant. The most common occurrence of lubricant mix-ups happens when an oil system is "topped off" to replace the oil that has been lost due to use or leakage. Usually a small amount of incorrect oil in a large closed loop system presents few immediate problems. However, large quantities of an incorrect lubricant or mixing types that are not compatible can lead to serious maintenance problems and even equipment failures. A condition monitoring program can readily identify such problems through the analysis of the lubricant additive package and lubricant physical property analysis. Instruments such as the FluidScan can perform this analysis at-site for an immediate determination negating the need for delays in sending samples to a laboratory.
Capability to Identify Lubricant Mix-Ups
In order to demonstrate the capability of the FluidScan to identify fluid mixups, tests were performed on two mixed fluid scenarios:
1. Hydraulic / Lubricating Oil Mix - a synthetic hydraulic fluid (MIL-PRF-83282) mixed with a synthetic polyol ester fluid (MILPRF- 23699)
2. Petroleum Base Hydraulic Fluid / Synthetic Hydraulic Fluid Mix - a petroleum based hydraulic fluid (MIL-PRF-5606) mixed with a synthetic hydraulic fluid (MIL-PRF-83282)
Controlled blends of two fluid combinations were made in the laboratory for the requirements of the test. The hydraulic/lubrication oil mix was prepared with mixes of 5% to 95% and the synthetic hydraulic fluid / petroleum base hydraulic fluid mix in five steps from 1% to 5%. All samples were then measured with the FluidScan to demonstrate the capability to differentiate among the mix-up levels and to provide accurate readings.
Repeatability of the FluidScan in Detecting Lubricant Mix-Ups
Next, both sets of fluid mix-up scenarios, described above, were analyzed by the FluidScan at the Army Oil Analysis Laboratory (AOAP) at Huntsville, Alabama at fixed levels and with multiple data repetitions. The purpose was to assess the repeatability of the FluidScan on these types of samples. Analytical results for both scenarios showed that the FluidScan provided both accurate and stable readings of these fluid mix-ups, as shown in the data below:
Hydraulic / Lubricating Oil Mix - MIL-PRF-83282 and MIL-PRF-23699
The data in Figure 1 show the spectra of various blend levels of MIL-PRF-23699 in MIL-PRF-83282 in the IR fingerprint region as recorded by the FluidScan. The scans verify that varying levels of fluid mix-up can be detected and differentiated by FluidScan.
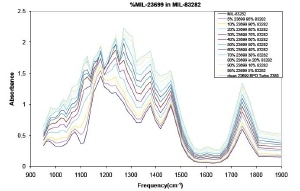
Figure 1. FluidScan IR spectra of MIL-PRF-23699 contamination in MIL-PRF-83282 in the IR fingerprint region. This region of the infrared spectrum is used to determine the contamination level.
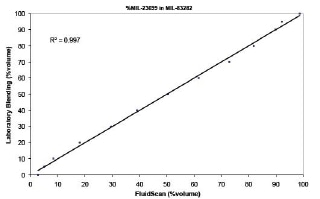
Figure 2. MIL-PRF-23699 contamination in MIL-PRF-83282 determined by the FluidScan relative to the as-blended laboratory values.
In Figure 2. it can be seen that the various blend combinations track closely with the analyses as measured by the FluidScan and that the blend levels can be differentiated from each other. The repeatability tests as carried out at the AOAP laboratory in Huntsville tested MIL-PRF-23699 contamination at the 20% level in MIL-PRF-83282. This level was determined via laboratory blending. “Run A” was taken with a nominally fresh sample of MIL-PRF-83282 with no contamination. The test protocol called for withdrawing 6 ml of fluid by syringe from a given test sample bottle and then injecting 2ml of fluid into the FluidScan for analysis. The analysis was performed for each fluid aliquot within 2 minutes and the results were recorded.
Fluid from a second bottle was then drawn, injected into the FluidScan cell, and repeated seven (7) times for each fluid mix-up scenario. No rereferencing (taking of a background reading) of the FluidScan was taken during the entirety of each test sequence. The results show that the reading of 20% MIL-PRF-23699 contaminated sample reads an average of 22.7% with a standard deviation of approximately 1.5%.
Petroleum Base Hydraulic Fluid / Synthetic Hydraulic Fluid Mix - MIL-PRF-5606 and MIL-PRF-83282
The spectra in Figure 3 show the behavior of MIL-PRF-5606 in MIL-PRF-83282 at low levels of contamination in the IR fingerprint region as recorded by the FluidScan. In this scenario, dilution ratios between 0% and 5% were blended in the laboratory in increments of 1%. The purpose of the test was to determine the sensitivity of the FluidScan in detecting very low levels of fluid mix-ups. In Figure 4 the as-prepared contamination values can be seen to track with those measured by the FluidScan.
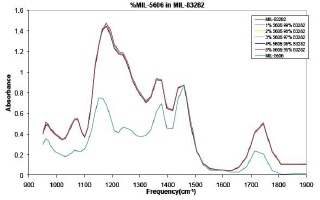
Figure 3. FluidScan IR spectra of MIL-PRF-5606 contamination in MIL-PRF-83282 in the IR fingerprint region. As for the case of MIL-PRF-23699, his region of the infrared spectrum is used to determine the contamination level.
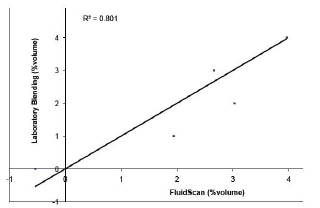
Figure 4. MIL-PRF-5606 blended into MIL-PRF-83282 determined by the FluidScan relative to the as-blended laboratory values.
The second part of this test to determine the sensitivity of the FluidScan in determining very low levels of fluid mix-ups was also carried out at the AOAP laboratory in Huntsville, Alabama. It tested MILPRF- 5606 contamination at the 3% level in MIL-PRF-83282, much lower than the level tested in the MIL-PRF-23699 scenario. This level was also determined via laboratory blending.
The test protocol was identical to the one for the other mix-up scenario and called for a syringe to draw 6 mL of fluid from a given test bottle and then inject 2 mL into the FluidScan for analysis. The analysis was performed for each fluid aliquot within 2 minutes and the results were recorded. Fluid from a second bottle was then drawn, injected into the FluidScan cell, repeated seven (7) times for each fluid mix-up scenario. No re-referencing (taking of a background reading) of the FluidScan was taken during the entirety of each test sequence.
“Run A” was taken with a nominally fresh sample of MILPRF- 5606 with no contamination. The results show that for 3% contamination by MILPRF- 5606 the readings average 2.8% with a standard deviation of approximately 0.55%. These data show even at the 3% level MILPRF- 5606 can be registered at nearly 2x the 3-sigma confidence level (1.64%) measured for the data.
Summary
The tests and data as described in this application note demonstrate that the FluidScan can provide high quality analytical results for lubricant mix-ups comparable to those provided by laboratory instruments. Mix-up levels as low as 3% incorrect lubricant can be detected.
The FluidScan provides beneficial information on fluid degradation that can be used in maintenance recommendations based on oil analysis. By providing such results at the site of the equipment, corrective action can be taken in a more timely manner without having to wait for analysis results from a central laboratory.

This information has been sourced, reviewed and adapted from materials provided by AMETEK Spectro Scientific.
For more information on this source, please visit AMETEK Spectro Scientific.