Analytical high-performance liquid chromatography (HPLC) is widely used in the analytical chemistry field to identify and quantify molecular species present in a sample. The concept and application of ultra-high performance liquid chromatography (UHPLC) is similar to HPLC but have smaller beads and columns compared to HPLC. Understanding the requirement for an on-line UHPLC dRI detector, Wyatt Technology introduced the Optilab UT-rEX in February 2013.
The UT-rEX fulfills the requirements of UHPLC owing to significantly minimized band broadening-maintaining the narrow peak widths quality of UHPLC in addition to higher data rate to embrace the unique combination of high flow rate and narrow peaks.
Moreover, the UT-rEX includes the same photodiode array technology and temperature regulation as the T-rEX. This article covers several basic UHPLC analyses by means of UT-rEX dRI detection.
Protein Fragment or Impurity
Bovine serum albumin (BSA), a typical reagent used for the calibration of protein quantitation and concentration measurements, normally contains 97-98% of monomeric content and some amount of proteinaceous material, most of which are irreversible aggregates of BSA such as dimmers and trimers.
High-resolution separation using UHPLC provides a new characteristic in Sigma-Aldrich BSA, a small peak eluting later than the primary monomer, as illustrated in Figure 1.
The new peak is visible in both the UV and UT-rEX dRI chromatographic traces. However, it is not possible to differentiate between any of the potential sources of the small peak by means of UV or RI detection alone.
Nevertheless, the new peak’s UV:RI ratio is 60-70% greater than that of the monomer, implying that the new species contains more UV-active material than the monomer. This, in turn, indicates that the new species cannot be a misfolded BSA or aggregate, but must be either an impurity or fragment.
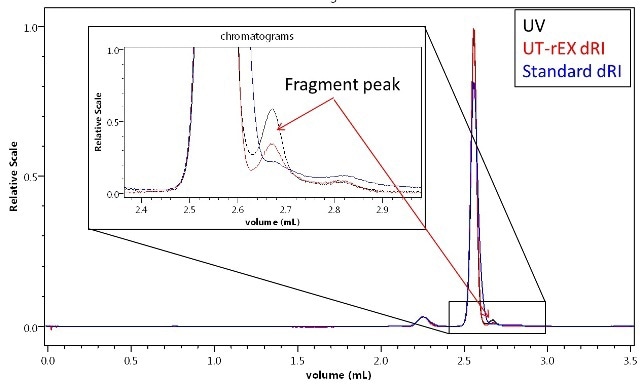
Figure 1. A minor impurity or fragment detected in BSA by UHPLC with a 300 mm size-exclusion column and UV + UT-rEX RI. The different UV:RI ratio of the fragment relative to the monomer and dimer indicate a different primary composition.
Isomers
It may not be possible to differentiate the isomers by means of standard HPLC size exclusion chromatography (SEC), or UHPLC SEC that uses a short column (150 mm), unless isomers differ greatly in shapes. On the other hand, installing a long column (300 mm) significantly improves the UHPLC separation, thus enabling to resolve drastically differentiated isomers, as shown in Figure 2.
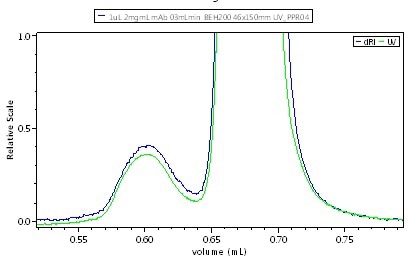
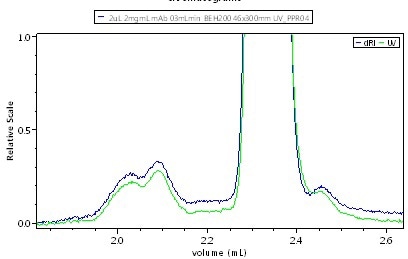
Figure 2. UHPLC-SEC chromatogram of IgG, UV + UT-rEX RI. Top: short, 150 mm column shows monomer and dimer but nothing more.Top: short, 150 mm column shows monomer and dimer but nothing more. Bottom: long, 300 mm column resolves additional species. The common UV:RI ratio indicates that all species have about the same primary sequence and so the new peaks are probably isomers of the monomer and dimer.
As shown in Figure 2, differentiated peaks are visible at the trailing edge of both the monomer and dimer. When compared the ratio of UV:RI to determine the composition of these species, all the peaks show the same UV:RI ratio, indicating that one pair is monomeric isomers and another pair is dimeric isomers.
Universal Detection and Column Calibration
When compared to other detection techniques, refractive index detection is relatively versatile and virtually universal, as long as an isocratic method is utilized. The peaks areas are combined to identify the detector response. dRI can handle many different samples, including oils, synthetic polymers, small-molecule drug compounds, lipids, oligonucleotides, carbohydrates, and proteins.
The separation of sugars by means of the combination of the UT-rEX and a reverse-phase UHPLC column is illustrated in Figure 3. Calibration of a UHPLC size-exclusion column with common protein standards by the UT-rEX is depicted in Figure 4, showing good calibration linearity throughout the entire range of molar masses.
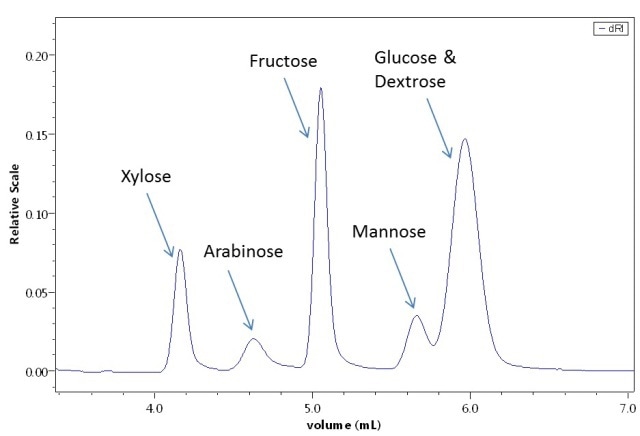
Figure 3. Sugar separation on a special UHPLC column, detected by the UT-rEX.
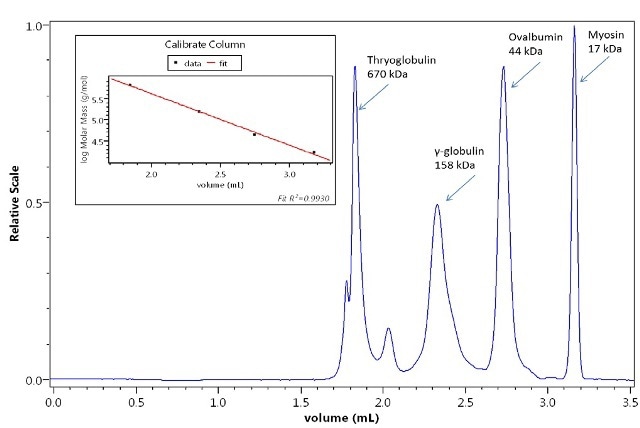
Figure 4. Calibration of a column with protein standards by the UT-rEX. The calibration curve is highly linear.
Peak Area Linearity
A standard approach of testing linearity is by injecting a chain of aliquots consisting of various total masses, as measured by dry weight. The peak areas are combined to identify the detector response.
Figure 5 shows the plotting of the outstanding linear response of the peak areas determined by the UT-rEX against injected mass. This linearity is consistent throughout the entire dynamic range of ±4.7 x 10⁻³ RIU, which corresponds to ~ 35 mg/ mL carbohydrate or 25 mg/mL protein. This ensures that the detector response will not saturate for separation by means of any analytical chromatography, including the most preparative chromatography.
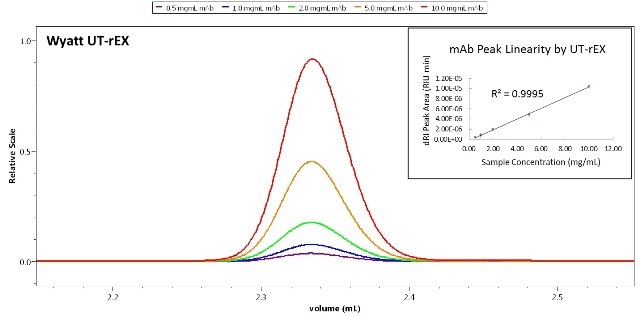
Figure 5. Linear quantitation response of the UT-rEX. The detector is linear over a very wide range, up to ~ 25 mg/ mL protein.
UV-Inactive Impurity Detection
Analytical UHPLC-SEC integrating a UV detector is typically used for quality control of a UV-active substance such as a protein. Nevertheless, contaminants in the sample may not always possess chromophores and eventually will pass through unnoticed. In such cases, adulterated samples will clear QC tests.
Combined UV-RI analysis of three protein samples: pure IgG (red), and IgG contaminated with two representative impurities, 10 kDa dextran (blue) and 40 kDa dextran (green) are illustrated in Figure 6. Figure 6a shows the overlaid UV traces and Figure 6b shows the overlaid RI traces. How the impurities are differentiated from the protein by means of dual detection is illustrated through the comparison of the two figures.
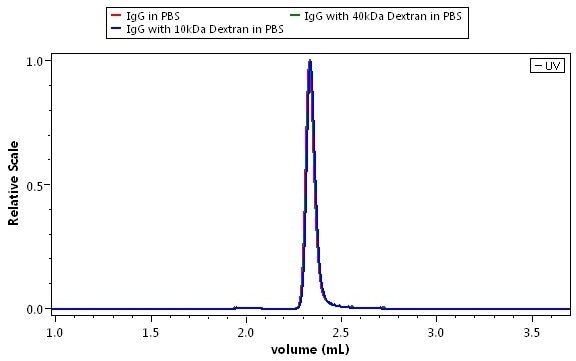
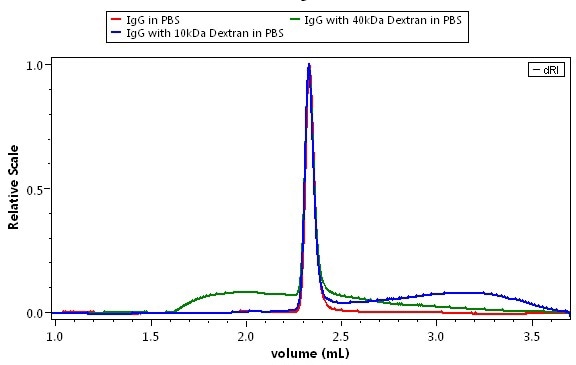
Figure 6. Discovery of impurities in a protein analysis. Mobile phase is phosphate buffered saline. Green: pure IgG; blue: IgG + 10 kDa dextran; magent: IgG + 40 kDa dextran. Top: UV detection. Bottom: dRI detection by the UT-rEX.
Sample Detection Against a Solvent Gradient
Solvent gradients are typically associated with drastic changes in the refractive index of the mobile phase, overwhelming and saturating a majority of the on-line differential refractive index detectors.
The UT-rEX also benefits from the same extended dynamic range of the Optilab T-rEX, enabling it to accommodate these large variations, while retaining the sensitivity even though the solvent gradient allows small sample peak detection.
Figure 7 depicts an illustration of gradient chromatography with dRI detection, leveraging the extended range of the Optilab rEX technology on a standard HPLC system. Although the refractive index varies greatly throughout the chromatogram, the UT-rEX dRI detection is able to clearly capture the eluting lysozyme peak and resolve a variant or impurity from the primary species.
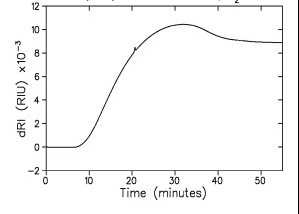
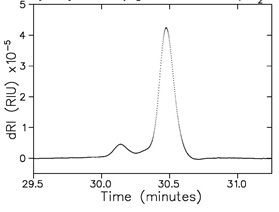
Figure 7. Analysis of a reverse phase acetonitrile/water gradient, 10% → 90%, by dRI. The sample is lysozyme. Top: raw data with 250 μg injection of lysozyme which appears as a small feature on a drastically changing RI signal. Bottom: after baseline subtraction, this time from a 25 μg injection of lysozyme (which is practically invisible against the gradient baseline). The early-eluting, small peak is unidentified.
Conclusions
The Optilab UT-rEX is a universal detector, enabling either stand-alone operation as the sole on-line detector downstream of a UHPLC column, or can be used in conjunction with another detector such as UV/Vis absorption. The aforementioned basic UHPLC clearly demonstrated the capability of this innovative detector.
The UT-rEX is compatible with any vendor's UHPLC system, and is especially suitable for fragile bio-molecules as it allows temperature regulation below ambient, down to 4°C, in a laboratory at standard room temperature. It is a valuable tool in any analytical laboratory using UHPLC technique.

This information has been sourced, reviewed and adapted from materials provided by Wyatt Technology.
For more information on this source, please visit Wyatt Technology.