Sponsored by HORIBADec 16 2013
Fluorescence anisotropy determines the depolarisation of the fluorescence emission. The key reasons for depolarization include energy transfer to another molecule with a different orientation or molecular rotation caused by Brownian motion.
Molecular motion is based on local environment factors such as molecular confinement and is based on local environmental factors, such as viscosity and molecular confinement, and the size of the molecule. Hence measuring fluorescence anisotropy is useful in obtaining information concerning molecular size and mobility.
Molecular Rotation
Most fluorophores absorb light in a preferred direction, which is parallel to their absorption dipole. In case polarized light is used for sample excitation then only a a subset of molecules, whose absorption dipoles are parallel to that light, will be excited. The excited molecules are not static and Brownian motion causes this subset to become disordered. With enough time the fluorescence emission will result from randomly oriented molecules. By monitoring both parallel and perpendicular planes of polarisation it is possible to follow this path from order to disorder, as illustrated in Fig. 1.

Figure 1. Schematic representation for molecular rotation after absorption of vertically polarised light, which is emitted from a random orientation (assumes absorption and emission dipoles parallel). The change in anisotropy (red axis) with time (blue axis) is indicated.
A measure of this is the fluorescence anisotropy, r, which relates to the intensities (I) of the planes (↕,↔) of polarisation, defined as,

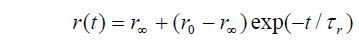
In the simplest case the change of anisotropy with time is given by,

Where r0 is the initial anisotropy and ranges from 0.4 (parallel transition dipoles) to -0.2 (perpendicular dipoles). While using 2- photon excitation these values are different.
τr is the rotational correlation time, which can be considered a measure of the order-disorder process. The steady state anisotropy can be represented by:

Even though simple to measure, this offers an incomplete description of the process compared to a time resolved measurement, which enables r0 and τr, as well as the fluorescence lifetime, to be determined. The rotational correlation time can be related to the rotational diffusion coefficient (Dr) and in the simplest case to the effective volume (V) and local viscosity (η) by the following,

Here k is Boltzman’s constant and T the absolute temperature. Hence, a time-resolved measurement returning a value of τr can be used for providing information about molecular size and the fluidity of the medium containing the molecule. Although, care in interpretation is required as only equivalent viscosities and relative changes can be realistically determined.
Hindered Rotation
In case the fluorophore is not fully free to rotate then a non zero limiting anisotropy, manifest in the anisotropy decay below (Fig. 2.), can be considered.

Figure 2. Illustration of a limiting value in the anisotropy decay
Time resolved measurement is shown as follows:
While considering a “wobble in cone” model, the ratio of the initial and limiting anisotropies can be used to calculate a semicone angle, which reflects the degree of orientational constraint exercised by the medium in which the molecule is situated.
Time-Resolved Measurements
There are certain practical considerations that need to be considered while measuring time-resolved anisotropy. Some aspects are briefly considered below:
Choice of probe molecule - The lifetime of the probe should be similar to τr . If the lifetime is much shorter than τr the fluorescence is over before the molecular rotation is complete, making determination of problematic.
Equipment Polarisation Bias
Monochromators and detectors may have a bias for one plane of polarization over the other. A correction (g-factor) measurement should be done, involving the use of horizontally polarised excitation incident on the sample. Note that the g-factor is wavelength dependent, hence needs repeating if different measurement conditions are used.
Fit to Difference or Raw Anisotropy Data
Instrumental distortion may be included in the raw anisotropy data so fitting to the difference file (obtained from data analysis and relates to the numerator in the first equation) is advisable. This distortion is removed by using reconvolution and short rotational correlation times are recovered.
Additional Use of Polarised Measurements
It must be noted that while exciting a sample with a fast polarised laser pulse, polarisation effects can be present. This causes the regular fluorescence decay appear more complex and can relate to depolarisation effects. It is advisable to use a vertically orientated polarizer on the excitation and the emission polarizer at the magic angle (54.7° to the vertical) to remove these depolarisation effects.
Applications
The applications are:
- Uncovering homoFRET
- Molecular interactions / binding
- Energy migration
- Local viscosity
- Molecular confinement
- Membrane phase transition

This information has been sourced, reviewed and adapted from materials provided by HORIBA.
For more information on this source, please visit HORIBA.