Dynamic light scattering (DLS) is a well-known technique used for determining sample interactions, sample polydispersity and the hydrodynamic diameter of biotherapeutic proteins in solution. Raman spectroscopy is another well-established technique that derives information about the secondary and tertiary structure of protein by monitoring molecular vibrations.
By integrating these two analytical techniques into a single instrument, a range of physical, chemical and structural parameters can be determined. Secondary and tertiary structure of protein, onset temperature of aggregation, melting temperature, transition enthalpy values, protein solubility, aggregation propensity, and the potential for high viscosities at formulated concentrations can all be derived.
The results obtained from Raman spectroscopy and DLS on the same sample may give unique insights into the mechanisms of unfolding and aggregation. This article describes how DLS can be used to understand the colloidal stability of protein therapeutics.
Methods and Materials
The Zetasizer Helix (ZS Helix) from Malvern Panalytical incorporates a fiber-coupled Raman spectrometer with a Zetasizer Nano ZSP to provide Raman (conformational stability) and DLS (colloidal stability) in sequence on a single sample. The Zetasizer Nano system incorporates proprietary non-invasive backscatter (NIBS) detector technology with electrophoretic (ELS) static (SLS) and dynamic (DLS) light scattering to determine proteins’ hydrodynamic radius from 0.15 nm to 5 µm, from 0.1 mg/mL to > 100 mg/mL.
Raman spectra are collected using a 785 nm excitation (~280 mW) from 150 to 1925 cm-1 at a 4 cm-1 resolution. Sample aliquots (~120 |L) are then introduced into a 3 mm quartz cuvette and placed in a compartment that provides temperature control from 0°C to 90°C ± 0.1°C.
Following this, thermal ramp studies are performed by acquiring DLS and Raman data over a range of pre-defined 0.1°C -5°C step-wise increments. Next, isothermal incubation studies are carried out by collecting a set of DLS and Raman data over a predefined time interval at a preferred temperature point.
Results and Discussion
Measuring Protein Size at High Concentration
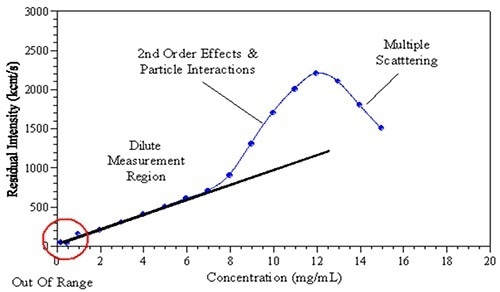
Figure 1. The observed effects of increased sample concentration on the measured light scattering intensity.
In recent years, the formulation of monoclonal antibodies at high concentration attracted significant attention in the biopharmaceutical industry. However, for DLS, multiple experimental factors limit size measurement at formulated concentrations. Increasing the sample concentration could impact the observed scattering intensity and thus the size determination (Figure 1). Factors that affect measurement may include:
- Viscosity
- Multiple scattering
- Positive/negative virial effects
- Self-association
Deconvolution of the above effects helps when interpreting high-concentration sample results.
In order to understand the effects of the above mentioned factors on the DLS data, it is important to consider an individual effect separately. Table I shows the predicted changes with increasing sample concentration to the reported size, correlation function, polydispersity, and also established correction techniques, for each of the unwanted factors.
Table 1. Summary of the effects of high concentration sample on DLS parameters.
| Factors |
Apparent Size |
Apparent Polydispersity |
Correlation Intersection |
Correction Method |
| Multiple Scattering |
Decrease |
Increase |
Decrease |
Backscattering |
| Restricted Diffusion |
Increase |
No Change |
No Change |
Viscosity Correction |
| Negative B22 |
Increase |
Increase |
No Change |
No |
| Positive B22 |
Decrease |
No Change |
No Change |
No |
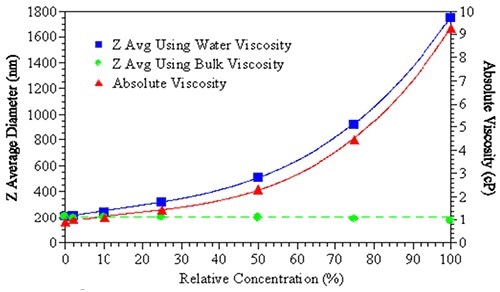
Figure 2. The effects of bulk viscosity correction on the size measurement results.
The effect of viscosity correction on the reported size of a sample is shown in Figure 2. Using water’s viscosity as an estimate of the sample viscosity leads to an increase the apparent size of the suspended particles (blue squares).
However, when the actual bulk solution viscosity is used in order to fit the DLS results, no obvious size change is observed (green circles). Particle interaction terms including repulsive/attractive, kD (diffusion interaction parameter) or B22 (second virial coefficient) could be indicated. For virial effects, no substantiated technique is available to correct the DLS data.
Detecting Onset of Protein Aggregation
Turbidity or static light scattering (SLS) combined with thermal ramping have been traditionally employed as fast formulation screening tools for protein stability. These techniques determine the aggregation onset temperature Tonset. The DLS method can also be used in this way.
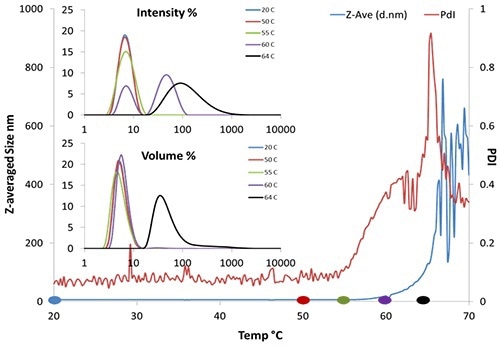
Figure 3. DLS thermal ramping of BSA (50 mg/mL pH 7.4).
Figure 3 shows the aggregation onset for BSA is about 62°C by Z-averaged size. Moreover, provided that the correlogram remains valid, DLS offers polydispersity and the size distribution (Figure 3, insert), whereas SLS provides only the intensity.
Here, the size distribution trend shows the emergence of a second peak at 90nm near 60°C. The onset temperature from polydispersity could be as early as 55°C, implying that aggregation may commence even earlier.
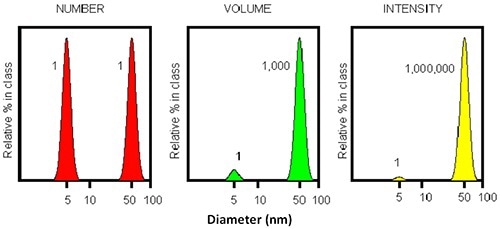
Figure 4. Illustration of the intensity profile of two particles with 5 and 50 nm diameter. The intensity ratio will be 1:1000000.
The inherent sensitivity of DLS is very useful when detecting small amounts of aggregates. Figure 4 shows that for a mixture of two particles having an order of magnitude difference in diameter, the larger particle (50nm) will display a scattering intensity which is a million times stronger than that of the smaller particle (5nm).
This shows that a single large particle combined with numerous tiny particles results in an equal intensity being detected. Thus, DLS may be used as the earliest detector for aggregate appearance. However, the resolution of DLS is restricted to a factor of three in size.
Predicting Colloidal Stability
Although Tonset may be adequate for initial formulation screening, a better understanding of protein interaction and protein stability cannot be achieved from such experiments.
Recently, intermolecular parameters were considered as predictors of protein aggregation kinetics, which have been correlated with kDand B22. A large positive value of B22 denotes that solutes favor association with the solvent over self-association, either due to the positive interaction between solvent and solute or the strong electrostatic repulsion between solute molecules. On the other hand, large negative values of B22 indicate powerful self-attractive systems, in which the particles favor aggregation or self-association over complete solvation.
In the case of DLS, kD can be calculated directly and it related to B22 by the following equations:
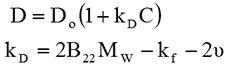
Here, D refers to the diffusion coefficient calculated by DLS, C is the sample concentration and D0 is the self-diffusion coefficient. kf is the first order concentration coefficient of the friction, Mw is the sample molecular weight and v is the partial specific volume of the solute.
The experiments below show how kD can be applied to predict the stability of protein for an IgG in four formulations. In Figure 5, it can be seen that only Soup 2 (red circles) has a positive kD, suggesting a powerful repulsive interaction between the protein samples - the other three samples display slightly negative kD. The large positive kD often indicates positive B22 or strong repulsive interactions. However, when kD is near zero it is difficult to directly link to B22.
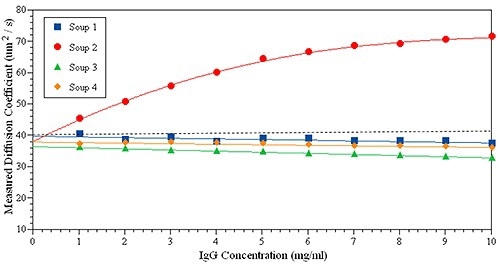
Figure 5. kD plot measured for the same IgG solution in four formulations.
SLS can be determined at a fixed angle for B22, and zeta potential can be determined to provide relative charge (Table 2). Using all the information, a complete profile of protein properties can be achieved to predict the stability of protein. For instance, let us predict that formulation 1 is the least stable for this IgG, while formulation 2 is the most stable.
Table 2. Summary of predictive parameters for IgG stability.
| IgG Formulation |
B22 (10-5ml mol/g2) |
kD (ml/g) |
Charge |
| Soup 1 |
-1.5 |
-5.2 |
3.3 |
| Soup 2 |
127.5 |
31.9 |
9.7 |
| Soup 3 |
10.4 |
-9.7 |
5.1 |
| Soup 4 |
2.3 |
-4.7 |
-2.8 |
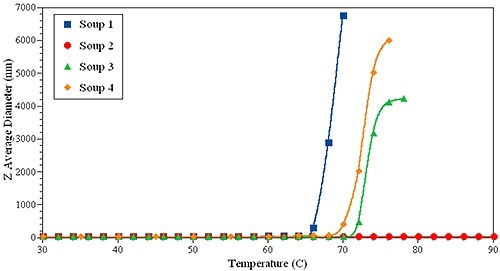
Figure 6. DLS thermal ramping of one IgG sample in four different formulations.
To support this prediction, thermal ramping experiments were carried out on the same set of samples (Figure 6). Surprisingly, sample 1 had the lowest Tonset, while formulation 2 was the most stable, indicating no evidence of large aggregates up to 90°C.
Conclusion
The integration of Raman spectroscopy and DLS into a single instrument offers unique analytical capabilities which can be used to determine melting the temperature, secondary and tertiary structure of protein, and the size and onset of aggregation for the same sample, without changing the testing conditions. When combined with NIBS technology, DLS provides a unique way in which to derive the particle interaction parameter (B22), the bulk viscosity and limited diffusion interaction parameter (kD), onset temperature of aggregation, melting temperature, and transition enthalpies of high concentration formulations.
Future studies are expected to give an insight into the exclusive correlations which may be derived from the combination of Raman spectroscopy and DLS in order to improve the understanding of the mechanisms, kinetics, and thermodynamics of aggregation.

This information has been sourced, reviewed and adapted from materials provided by Malvern Panalytical.
For more information on this source, please visit Malvern Panalytical.