Currently, the European polymer industry needs to determine more than 60 chemical elements in polymer materials, in concentrations ranging from percent to ppb levels. A variety of inorganic compounds are commonly added to polymers in order to enhance or suppress specific properties.
It is essential to regulate polymer properties at each stage of production. For instance, during the production of a key material, during the molding of materials into end products or during the lifespan of the products such as pigments, catalysts, lubricants, anti-oxidants, fire retardants etc. For example:
- Al, Mg, Zn and Ti are used as catalysts
- Ti and Zn are used as pigments
- Ca is used as a lubricant
- Al, Zn and P are used as fire retardants
These elements are used as fillers and additives to improve the safety and quality of products for consumers. Stringent measures should be taken during the manufacture and development of plastics because these materials contain different types of compounds.
XRF spectroscopy is an analytical technique that is often used in the polymer sector for the quantitative determination of additive concentration. This technique offers several benefits over other analytical methods which are time intensive and are destructive by nature.
Preparation of Standards and Samples
Calibrations were made by using a range of in-house polymer standards, namely polypropylene and polyethylene. Several granules weighing 2 to 5g were taken and hot-pressed between two plates to mold the polymer samples into 40 mm diameter disks.
Spacers were used between the plates to achieve 2 mm-thick polymer disks. Before measurement, iso-propanol was used to clean the polymer samples to prevent any risk of contamination.
Analytical Conditions
The polymers edition of the Zetium XRF spectrometer is a wavelength dispersive and energy dispersive XRF analyzer which is integrated with an X-Y sample handler, a spectrometer and software. The high-sensitive wavelength dispersive optics combined with excellent stability offers the precision required for quick and low-level analysis of light elements.
The system is built-in with SuperQ analysis software which features an intuitive user interface to easily perform precise quantitative analysis. For Al and P testing unique curved crystals were used to improve both the spectral resolution and sensitivity.
As recommended by the software, the instrument’s analytical conditions were optimized before studying the additives in polymers.
Table 1 shows the overall measurement times for all elements in the polymer sample.
Table 1. Total measurement time (peak + background)
| Element |
Mg |
Al |
P |
Ca |
Ti |
Zn |
| Total time (s) |
230 |
100 |
50 |
60 |
170 |
18 |
SST R-mAX X-Ray Tube with ZETA Technology
Excellent long-term stability is ensured with the SST R-mAX X-ray tube with ZETA technology. The very close pairing of the SST R-mAX gives high X-ray intensities at the surface of the sample. Better sensitivity is also achieved due to the high-transmission end-window design.
When polymer granules are hot-pressed into disk-shaped samples it can result in heterogeneities which negatively influence the accuracy of the analysis. However, if the samples are rotated in the X-ray beam these heterogeneities can be averaged. For this purpose the Zetium system comes with a rugged sample spinner.
Curved Crystals
When laterally curved crystals are used the intensity can be enhanced by 50%. At high take-off angles, the peak shapes continue to remain Gaussian with a high spectral resolution. The QuickStart option in the Zetium system can be started by placing the samples on the Zetium priority position. This function can make standard analysis simple and easy.
Precision and Instrument Stability
The Polymers edition of the Zetium XRF spectrometer has excellent accuracy, reproducibility and repeatability in terms of short-term measurements (20 successive measurements) and long-term measurements (measurements performed for 10 days).
The counting statistical error (CSE) is illustrated in Table 2 for comparison. A graphical representation of the analytical accuracy of Zn is shown in Figure 1.
Table 2. Analytical precision
| Element |
Mg |
Al |
P |
Ca |
Ti |
Zn |
| REPEATABILITY (20 consecutive measurements) |
| Mean (mg/kg) |
7.7 |
45.0 |
48.7 |
22.9 |
4.5 |
22.5 |
| RMS (ppm) |
0.3 |
0.3 |
0.5 |
0.9 |
0.4 |
0.9 |
| RMS (rel%) |
3.7 |
1.4 |
0.83 |
0.76 |
3.4 |
1.3 |
| REPRODUCIBILITY (measurements carried out over 10 days) |
| Mean (mg/kg) |
8.4 |
42.2 |
47.1 |
22.3 |
4.3 |
22.6 |
| RMS (mg/kg) |
0.2 |
0.5 |
0.5 |
0.3 |
0.2 |
0.3 |
| RMS (rel%) |
2.6 |
1.2 |
1.1 |
1.2 |
4.0 |
1.1 |
| COUNTING STATISTICAL ERROR |
| CSE (mg/kg) |
0.2 |
0.3 |
0.4 |
0.2 |
0.1 |
0.2 |
| SE (rel%) |
2.3 |
0.73 |
0.86 |
0.90 |
2.2 |
0.89 |
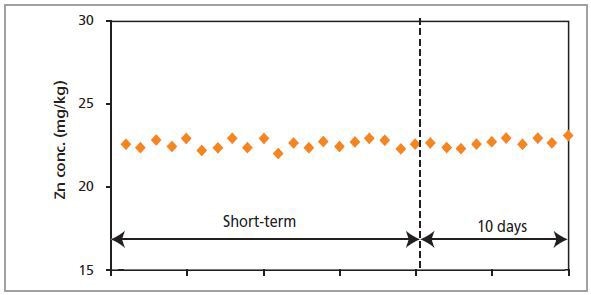
Figure 1. Short- and long-term stability measurements of Zn in a polymer standard
After 20 successive measurements of a polymer sample, standard deviations are found to be better than 2% at the 23 mg/kg level, for example 22.9 ± 0.2 mg/kg Ca. The same degree of accuracy is sustained for measurements that are performed over a span of 10 days, for instance with Al, P, Zn and Ca.
This demonstrates the Zetium’s long-term stability. Upon comparing these actual measurements with the counting statistical error, which is considered to be the minimum possible error, the system’s inherent stability becomes obvious.
Accuracy
Table 3 shows the calibration accuracy. The calibration RMS value is a numerical comparison of the certified chemical concentrations of the standards with the concentrations measured by regression in the calibration process.
Table 3. Calibration quality
| Element |
Calibration RMS (mg/kg) |
Concentration range (mg/kg) |
| Mg |
1.1 |
0 - 102 |
| Al |
2.0 |
0 - 100 |
| P |
0.48 |
10 - 70 |
| Ca |
0.36 |
0 - 50 |
| Ti |
0.08 |
1 - 10 |
| Zn |
0.14 |
0 - 50 |
In Figures 2 and 3, the calibration plots for Mg and Zn show a graphical representation of the method accuracy.
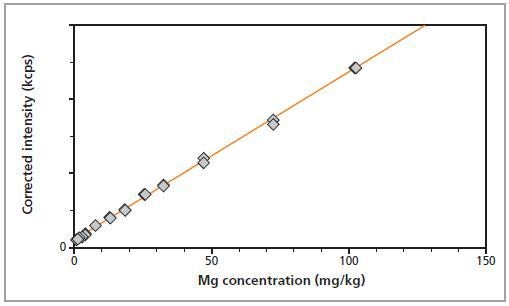
Figure 2. Calibration graph for Mg
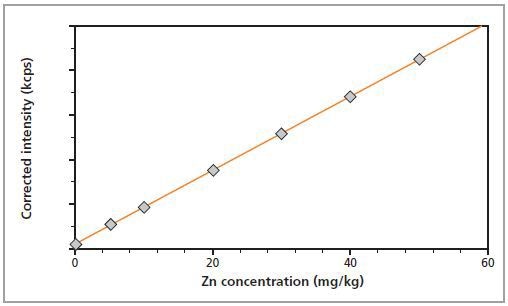
Figure 3. Calibration graph for Zn
Detection Limits
Table 4 shows the detection limits for the preferred analytes in standard polymer matrices.
Table 4. Detection limits
| Detection limit (mg/kg) |
Mg |
AI |
P |
Ca |
Ti |
Zn |
| LLD (100 s) |
0.32 |
0.20 |
0.11 |
0.20 |
0.28 |
0.13 |
The lower limit of detection (LLD) is determined using the following equation:
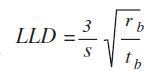
Where s is sensitivity (cps/mg/kg); tb is counting time background; and rb is the background count rate (cps).
The LLD values are normal for the polymer samples. Depending on sample matrix composition, the LLD values differ for each sample.
Conclusion
The article has demonstrated that the Polymers edition of the Zetium XRF spectrometer can be used for studying light elements present in polymer samples, in concentrations down to 1 ppm or less. This method not only provides accurate measurements but also offers easy and risk-free sample preparation.
Thanks to the excellent stability of the Zetium system, separate calibrations can be used for extended periods. Re-standardizations take a considerable amount of time but this is totally eliminated using the Zetium spectrometer. The final data acquired is shown to be consistent over time.

This information has been sourced, reviewed and adapted from materials provided by Malvern Panalytical.
For more information on this source, please visit Malvern Panalytical.