The characterization of macromolecules or particles in a dispersion is possible using Dynamic Light Scattering (DLS). This technique is a highly useful characterization method as it allows researchers to determine molecular sizes between the nanometer and micron range. Due to its high sensitivity, DLS also finds industrial application in the characterization of aggregates.
When carrying out DLS experiments dust from the shedding of the column, tracer aggregates, contamination from labware or spoiling filters, can pose a problem and algorithms have been developed to counter these problems.
This article explores a new method of processing DLS data, which gives insight into the presence of aggregates, whilst avoiding data being skewed for small particles. This method allows the size and relative abundance of aggregate to be determined.
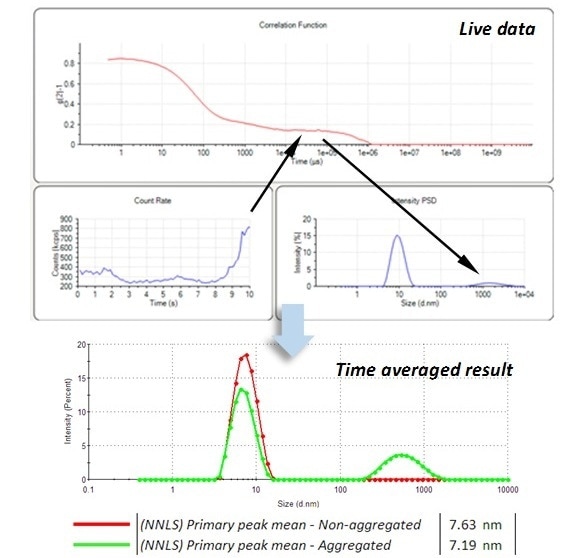
Figure 1. The appearance of an aggregate, t >8 s, in the live data, which can degrade the accuracy of the time-averaged, measurement of the primary peak at 7.6 nm.
Materials and Methods
The results demonstrated were produced by the analysis of Hen's egg lysozyme (supplied by Sigma-Aldrich) in pH 4.0 acetate buffer using a Zetasizer Ultra.
The results for the analysis of a mixed dispersion of NIST traceable polystyrene latex particles in 10 mM NaCl are also displayed.
All of the dispersions were produced using deionized water filtered to 200 nm.
Detecting Aggregates that aren’t Always Present
The detection volume in a DLS measurement is much smaller than the total volume of the sample presented to the instrument. While DLS measures a more statistically significant number of particles than methods such as nanoparticle tracking analysis (NTA) and scanning electron microscopy (SEM), it is possible for distinct particles to diffuse in and out of the detection volume during a measurement.
In a previous article, Malvern Panalytical discussed how, when taking Adaptive Correlation DLS measurements, data is grouped. A collection of sub-measurements are split into either transient or steady-state groups which, respectively, describes particles that enter and leave the detection volume, and particles which remain inside the detection volume.
Separating this data has two benefits. It makes the analysis of primary particle size more accurate, whilst also facilitating a more thorough characterization of the particles that are transient.
The differences in the correlation functions between the steady-state and transient sets are shown in Figure 2. The result that would be gained if everything had been group together (i.e. with no classification) is also shown.
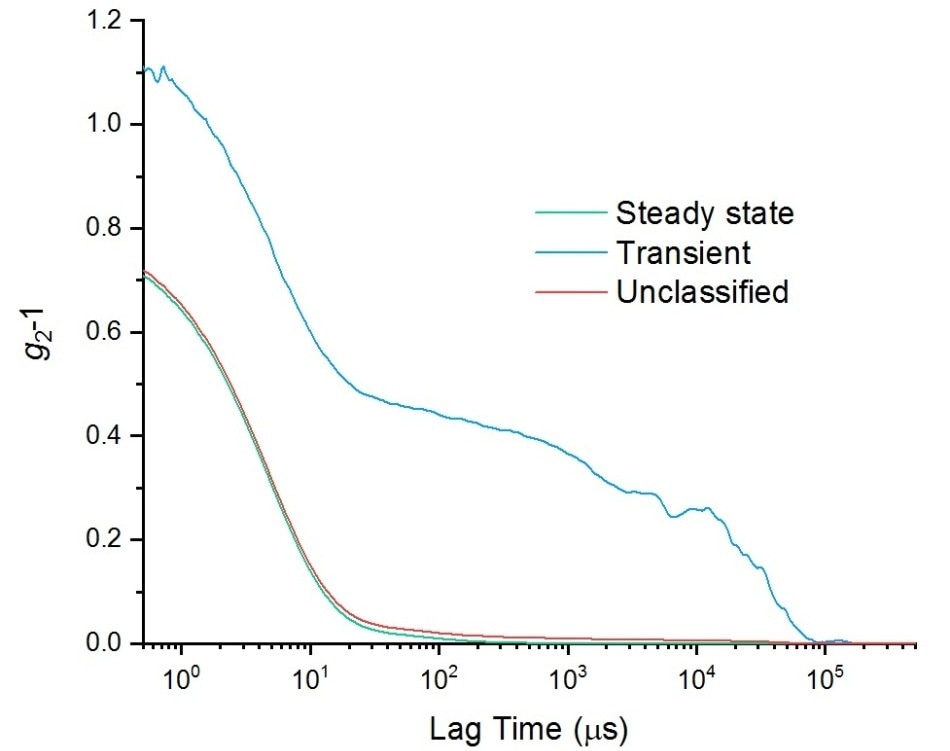
Figure 2. Autocorrelation functions for a sample of lysozyme, showing results for the steady state data, transient data, and unclassified data, i.e. all of the data.
As the transient portion of the data is only a small component of the total data, if no separation of data takes place the second decay in the transient correlation function (which has significant meaning) is not observed.
Figure 3 demonstrates why this data suppression should be avoided and the benefits of categorizing transients. Both the ungrouped and steady state plots show that there is an aggregate peak near to 100 nm, and a lysozyme monomer peak at 3.8 nm.
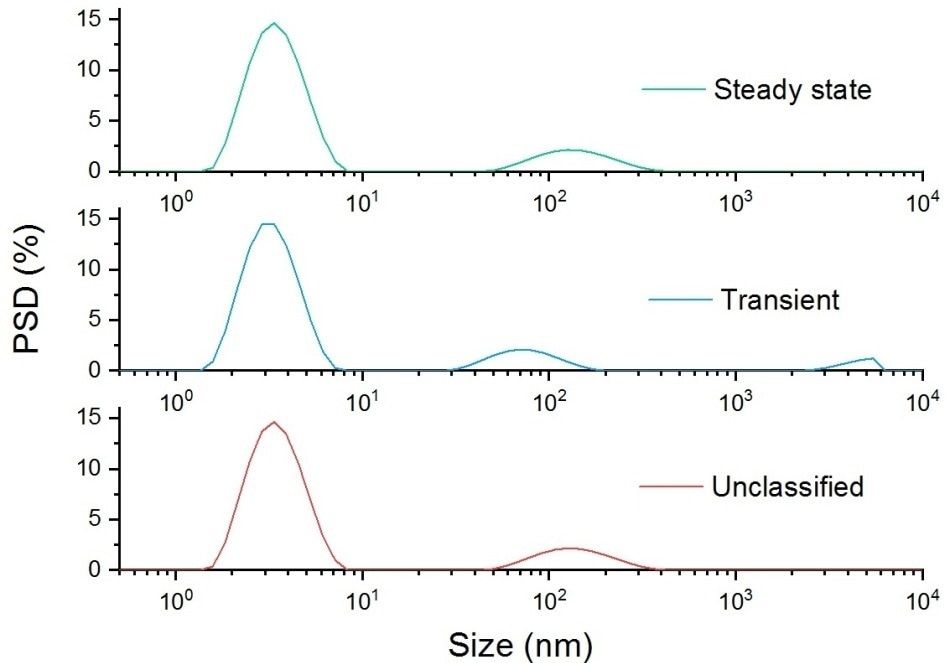
Figure 3. Steady state, transient and unclassified particle size distributions for a sample of aggregated lysozyme.
What becomes apparent by looking at the transient plot is that there is also another larger particle present, which has a peak at 5 µm. Using a grouped data set this peak would have not been observed.
This data also demonstrates that Adaptive Correlation is not a data filtering algorithm, as aggregates of a significantly larger size than the primary particle component are reported in the steady state result, as they are detected consistently throughout the measurement.
Characterizing Rare Particles
The reliability of DLS measurements can suffer due to sample scattering or if the particles being measured are at a below optimum concentration. The data provided in Figure 4 shows that using transient data allows rare large particles to be accurately characterized. This is demonstrated by the accurate sizing of particles (of known size) doped into a latex sample.
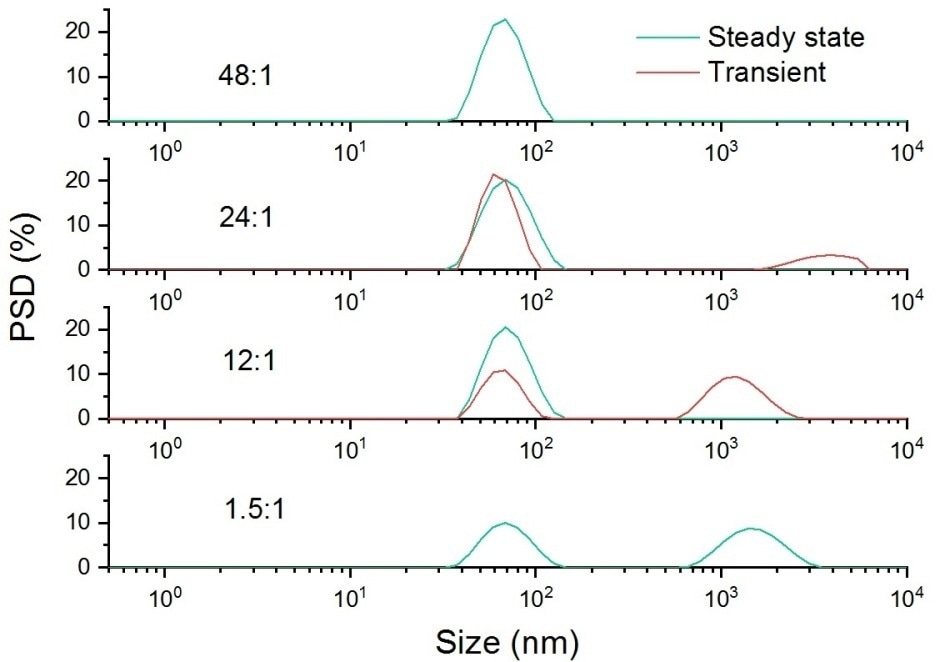
Figure 4. Intensity weighted particle size distribution for a sample of 60 nm latex dispersed in 10 mM NaCl, doped with a 1.6 um latex at a range of different ratios.
How Rare are Rare Particles?
It is only data that differs significantly from the samples majority characteristics that are identified as transient. Due to this the proportion of data that is classified as transient is wholly dependent on the sample.
The influence of transient particles on the total measurement can be assessed via their frequency of detection, which is determined by the volume of data in the steady-state section.
Table 1. Numerical results for a series of measurements for a sample of 1 mg/ml lysozyme
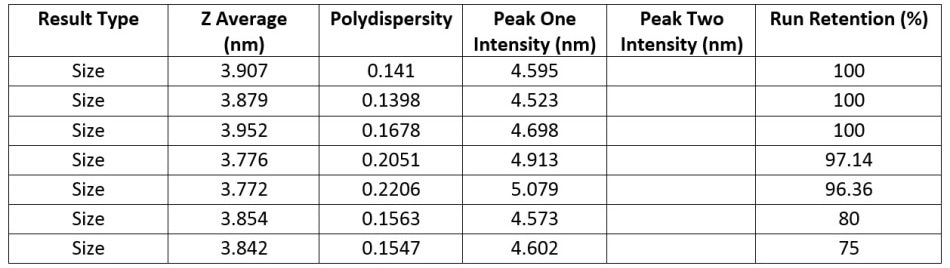
Table 1 shows the data for size measurements taken on a 1 mg mL-1 lysozyme sample that has been subject to thermal stress.
The data shows that for all samples the Z-average size is highly similar and the presence of only one size peak indicates all of the samples have a monomeric structure. However, it can also be concluded that the dispersion is not completely stable as the run retention (the percentage of the measurement that is steady state) decreases over time – meaning the transient measurement portion increases over time.
Dividing the data in this way allows researchers to confidently determine the enzymes hydrodynamic radius whilst also gaining insight into the stability of the solution.
Conclusion
Using a statistical measurement method to group data in terms of plurality allows differentiation between particles that remain inside the measurement volume, and therefore fully influence the measurement (steady state), and those that enter and exit the volume during measurement (transient).
This allows both the accurate collection of steady-state data which is unaffected by the effect of scattering by transient particles, whilst also allowing the determination of the transient particles at a resolution that would not be possible if the data was not grouped.
The size determination of transient particles using this method has been shown to be accurate via research where samples of known size doped in materials were measured. The volume of data in the transient group can also be used as an indicator of solution stability (i.e. how many aggregates are present) before they are so great in number they are seen in the steady-state result.

This information has been sourced, reviewed and adapted from materials provided by Malvern Panalytical.
For more information on this source, please visit Malvern Panalytical.