Using ICP-OES to determine rare earth elements (REE) in geological materials is one of the most complex analytical techniques.
The high matrix contents of digested samples require superior plasma robustness, frequently including large quantities of silica, alumina, refractory metals, and sulfur. This is particularly important when trace amounts of REE must be detected and sample dilution must be avoided.
The complexity of the technique is increased further by the high number of emission lines originating from both rare earth elements and the matrix, which can only be resolved by high spectral resolution.
This article outlines a technique for the investigation of two geological reference materials for sandstone (GSR-4) and granite (GSR-1) for its rare earth elements such as Dy, Ce, Eu, Er, Ho, Gd, Lu, La, Pr, Sm, Yb, and Nd. This was achieved through the use of high-resolution Array ICP-OES on a PlasmaQuant 9100 Elite supplied with HF Kit.
Interference-free measurement in both sandstone and granite was viable for the majority of REE elements due to the novel resolving power of the PlasmaQuant 9100 Elite’s high-resolution optics.
The CSI-Software feature successfully corrected significant spectral interferences from erbium, cerium, neodymium, and iron on sensitive emission lines of erbium, dysprosium, samarium, and lanthanum.
The results for granite (GSR-1) and sandstone (GSR-2) demonstrated excellent agreement with the certified values and quality RSD values. This article provides matrix-specific detection limits.
Materials and Methods
Samples and Reagents
- Sodium peroxide
- Geological reference materials for granite (GSR-1) and sandstone (GSR-4)
- Nitric acid
- REE single element standards
- Deionized water
Sample Preparation
Alkaline fusion (0.1 g sample + 0.6 g Na2O2) was used to digest the samples. 2 mL of nitric acid was added to the fusions and was filled up to 50 mL afterward. The subsequent nominal matrix content was around 12 g/L. These solutions were directly injected into the PlasmaQuant 9100 Elite.
Calibration
Matrix matched calibration standards were created from a Sodium Peroxide digestion blank utilizing REE-single elements standards (1000 mg/L, Sigma Aldrich) in adherence with the predicted concentration range in the analyzed samples. The calibration levels that were prepared are provided in Table 1.
Table 1. Concentration of calibration standards.
| Element |
Unit |
Cal.0 |
Cal.1 |
Cal.2 |
Cal.3 |
Cal.4 |
| Ce |
mg/L |
0 |
0.040 |
0.100 |
0.250 |
0.500 |
| Dy |
mg/L |
0 |
0.004 |
0.010 |
0.025 |
0.05 |
| Er |
mg/L |
0 |
0.004 |
0.010 |
0.025 |
0.05 |
| Eu |
mg/L |
0 |
0.004 |
0.010 |
0.025 |
0.05 |
| Gd |
mg/L |
0 |
0.004 |
0.010 |
0.025 |
0.05 |
| Ho |
mg/L |
0 |
0.004 |
0.010 |
0.025 |
0.05 |
| La |
mg/L |
0 |
0.020 |
0.050 |
0.125 |
0.250 |
| Lu |
mg/L |
0 |
0.004 |
0.010 |
0.025 |
0.05 |
| Nd |
mg/L |
0 |
0.040 |
0.100 |
0.250 |
0.500 |
| Pr |
mg/L |
0 |
0.004 |
0.010 |
0.025 |
0.05 |
| Sm |
mg/L |
0 |
0.004 |
0.010 |
0.025 |
0.05 |
| Yb |
mg/L |
0 |
0.004 |
0.010 |
0.025 |
0.05 |
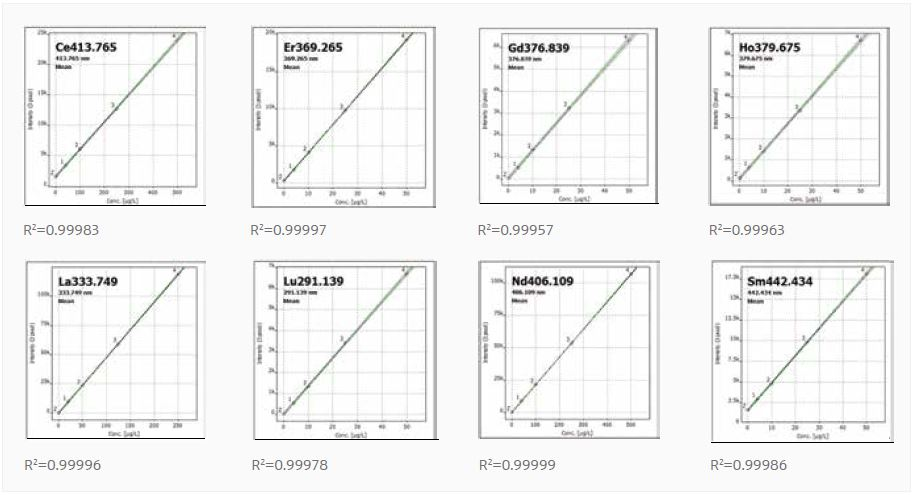
Figure 1 – 8. Calibration curves.
Instrumentation
A PlasmaQuant 9100 Elite was used to perform the analysis, along with the HF sample introduction kit and the ASPQ 3300 autosampler. Table 2 outlines the method settings along with a comprehensive description of the elements of the sample introduction system.
Table 2. Plasma configurations and set-up of the sample introduction system.
| Parameter |
Settings |
| Power |
1250 W |
| Plasma gas flow |
12 L/min |
| Auxiliary gas flow |
0.5 L/min |
| Nebulizer gas flow |
0.6 L/min |
| Nebulizer1 |
PFA parallel path nebulizer, 1.0 mL/min |
| Spray chamber1 |
PTFE cyclonic spray chamber, 50 mL |
| Outer tube/Inner tube1 |
Syalon / alumina |
| Injector1 |
Alumina, inner diameter 2 mm |
| Pump tubing |
PVC |
| Sample pump rate |
1.0 mL/min |
| Read delay/ Rinse |
45 s/ 20 s |
| Auto Sampler |
Yes |
1 Salt Kit may be used, too, for samples that do not contain hydrofluoric acid (HF)
Evaluation Parameters
Table 3. Overview of method-specific evaluation parameters.
| Element |
Line [nm] |
Plasma view |
Integration mode |
Read time [s] |
Evaluation |
| No. of Pixel |
Baseline fit |
Polynomial degree |
Correction |
| Ce |
413.765 |
axial |
peak |
3 |
3 |
ABC1 |
auto |
- |
| Dy |
353.170 |
axial |
peak |
3 |
3 |
ABC |
auto |
CSI2 |
| Er |
369.265 |
axial |
peak |
3 |
3 |
ABC |
auto |
CSI3 |
| Eu |
412.970 |
axial |
peak |
3 |
3 |
ABC |
auto |
- |
| Gd |
376.839 |
axial |
peak |
3 |
3 |
ABC |
auto |
- |
| Ho |
379.675 |
axial |
peak |
3 |
3 |
ABC |
auto |
- |
| La |
333.749 |
axial |
peak |
3 |
3 |
ABC |
auto |
CSI2,4 |
| Lu |
291.139 |
axial |
peak |
3 |
3 |
ABC |
auto |
- |
| Nd |
406.109 |
axial |
peak |
3 |
3 |
ABC |
auto |
- |
| Pr |
532.276 |
axial |
peak |
3 |
3 |
ABC |
auto |
- |
| Sm |
442.434 |
axial |
peak |
3 |
3 |
static |
auto |
CSI2,5 |
| Yb |
211.667 |
axial |
peak |
3 |
3 |
ABC |
auto |
- |
1 automatic baseline correction (ABC)
2 mathematical correction of spectral interferences from Neodymium
3 mathematical correction of spectral interferences from Iron
4 mathematical correction of spectral interferences from Erbium
5 mathematical correction of spectral interferences from Cerium
Results and Discussion
Table 4 provides a summary of the results obtained for the investigation of the certified reference materials GSR-1 and GSR-4 compared to the certified values. The use of a Na2O2 fusion digestion technique instead of an acidic digestion provides complete access to all REE in the analyzed samples.
The accurate analysis (RSD values significantly less than 5%) of the as-prepared, matrix-rich digestions was provided by the high plasma stability along with the PlasmaQuant 9100 Elite’s smart torch design.
As the instrument has a high resolution (FWHM Dy 353.170 ≤ 5.5 pm), strong interferences can be spectrally resolved, which provides the ability to investigate most of the REE with no requirement for additional mathematical correction algorithms.
In this study, only the elements erbium, dysprosium, samarium, and lanthanum required additional mathematical correction using the CSI software feature. The superior precision and accuracy attained by the applied technique proves its efficacy for the routine analysis of geological materials for REE.
Table 4. Overview of results for two geological reference materials comprising of granite (GSR-1) and sandstone (GSR-4).
| Element |
GSR-1 |
GSR-4 |
DL1 [µg/L] |
Measured value
[mg/kg] |
RSD2 [%] |
Certified value
[mg/kg] |
Measured value3
[mg/kg] |
RSD
[%] |
Certified value
[mg/kg] |
| Ce |
112 ± 2.3 |
0.09 |
108 ± 7 |
52.6 ± 2.2 |
0.92 |
48 ± 4 |
0.85 |
| Dy |
10.6 ± 0.97 |
2.7 |
10.2 ± 0.4 |
4.18 ± 0.96 |
1.8 |
4.1 ± 0.4 |
0.32 |
| Er |
7.0 ± 0.099 |
0.87 |
6.5 ± 0.3 |
2.15 ± 0.10 |
0.48 |
2 ± 0.3 |
0.15 |
| Eu |
0.705 ± 0.56 |
3.0 |
0.85 ± 0.07 |
1.00 ± 0.52 |
1.6 |
1.02 ± 0.08 |
0.04 |
| Gd |
10.3 ± 0.37 |
1.7 |
9.3 ± 0.7 |
4.76 ± 0.36 |
3.0 |
4.5 ± 0.4 |
0.36 |
| Ho |
2.22 ± 0.38 |
5.0 |
2.05 ± 0.17 |
0.841 ± 0.37 |
2.3 |
0.75 ± 0.12 |
0.11 |
| La |
53.4 ± 0.53 |
1.9 |
54 ± 4 |
21.9 ± 0.52 |
0.73 |
21 ± 2 |
0.14 |
| Lu |
1.11 ± 0.30 |
4.7 |
1.15 ± 0.09 |
0.257 ± 0.29 |
5.9 |
0.3 ± 0.03 |
0.19 |
| Nd |
48.6 ± 0.67 |
0.72 |
47 ± 4 |
23.8 ± 0.67 |
0.49 |
21 ± 2 |
0.34 |
| Pr |
12.2 ± 1.3 |
2.1 |
12.7 ± 0.8 |
5.65 ± 1.2 |
1.3 |
5.4 ± 0.6 |
1.55 |
| Sm |
9.23 ± 0.20 |
1.4 |
9.7 ± 0.8 |
4.70 ± 0.20 |
5.3 |
4.7 ± 0.3 |
0.65 |
| Yb |
7.67 ± 0.36 |
1.3 |
7.4 ± 0.5 |
2.15 ± 0.38 |
1.6 |
1.9 ± 0.2 |
0.34 |
1 Matrix-specific detection limit obtained from 3σ of SD for QC matrix blank (12 g/L Sodium peroxide),
2 RSD values obtained from three replicate measurements per sample
3 Confidence interval according to DIN 32645 and DIN 38402
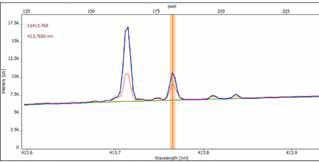
Figure 9. Ce 413.765 nm.
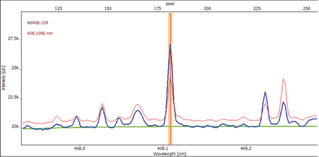
Figure 10. Nd 406.109 nm.
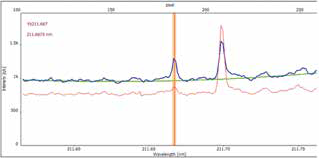
Figure 11. Yb 211.667 nm.
Figures 9-11. Collection of High-Resolution spectral data for granite, GSR-1 (blue) and sandstone, GSR-4 (red). Automatic baseline fit, ABC (green).
Conclusion
Multiple challenges can arise when analyzing rare earth elements (REE), for example, it can be challenging to gain complete access to all REE, analyze the matrix-rich samples, and there is a high possibility of significant spectral interferences.
The research design outlined in this article involves a fusion digestion technique utilizing a Na2O2 flux in combination with analysis by high-resolution ICP-OES on the PlasmaQuant 9100 Elite.
The fusion digestion enables residue-free digestion of complex geological matrices. All analytes, including both heavy and light REE, can be easily investigated.
A sample introduction system and a highly stable plasma performance are required to perform an analysis that is highly accurate and precise because the solutions as prepared carry both the flux matrix and the sample.
The PlasmaQuant 9100 Elite is supplied with a high-frequency generator for optimal plasma stability compared to other ICP-OES instrumentation. The analysis of the highest matrix content (for example 12 g/L fusion flux) is ensured utilizing its V-Shuttle torch, a fully demountable vertically-oriented torch, which removes the need for additional dilution which optimizes REE detection limits.
Matrix-specific detection limits in the range of ng/L to low µg/L can be attained. Significant spectral interferences originating from other REE or elements that are often present with REE, for example, iron, complicate precise measurement in geological materials.
The PlasmaQuant 9100 Elite showcases two effective features to resolve these spectral interferences: the CSI-Software tool and the optical system’s high resolution.
The high resolution enables severe interferences to be spectrally resolved with no need for additional mathematical correction schemes, and the CSI-Software tool can correct for more challenging interferences by using a mathematical correction to achieve an interference-free result. These features make the PlasmaQuant 9100 Elite the ideal analytical technology for the determination of REE in any geological sample.

This information has been sourced, reviewed, and adapted from materials provided by Analytik Jena US.
For more information on this source, please visit Analytik Jena US.