It is well documented that vibrational spectroscopy is an effective tool for polymer characterization.1,2 Raman and infrared spectroscopy are methods that complement one another and deliver a molecular fingerprint with the capacity to generate both quantitative and qualitative analyses.3
Generally, infrared spectroscopy can offer an exceptional variety of functional groups related to the polymeric composition, which leads to it being used extensively in structural characterization and polymer identification.
Additionally, Raman spectroscopy offers access to an assortment of functional groups, which facilitates the elucidation of chemical composition and structure. Raman spectroscopy typically probes non-polar chemical groups, such as strong characteristic aromatic bands and multiple C-C backbone vibrations.
These characteristic Raman bands offer comprehensive information on chain conformation as well as easy determination of aromatic-based polymeric systems.3 A straightforward but powerful quantitative analysis is necessary to determine the extent of polystyrene’s functionalization to create a water-soluble polymer.
The next generation of Raman instrumentation offers a small, economical, easy-to-use high-performing system. The robust characteristic Raman bands of the aromatic group and the negligible signal from water facilitate simple measurement of the final aqueous polymer to distinguish the extent of reaction.
Initial Evaluation of Raman Spectroscopy to Quantitate Polymer Functionalization Reaction
The initial starting polymer’s Raman spectra and that of the fully functionalized polymer both display strong characteristic aromatic bands for the initial and fully functionalized polymers (see Figure 1).
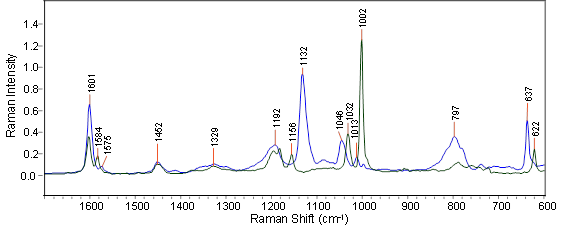
Figure 1. The FT-Raman spectra of the two pure polymer components: starting material polystyrene (green trace) and the fully functionalized polymer (blue trace) measured at 4 cm-1 resolution with 1064 nm excitation.
Image Credit: B&W Tek
The most powerful spectral features for the starting and fully functionalized polymers are seen as isolated bands at 1002 and 1132 cm-1, respectively. These distinctive spectral features signify that Raman spectroscopy is appropriate for the analysis and will facilitate either a simple conventional univariate band ratio method or a PLS-based (Partial Least Squares) quantitative method.
Analysis Deliverables
Well-planned chemometric analysis methods are necessary to establish the extent of the final polymer functionalization while being suitable for a plant quality control (QC) laboratory. This necessitates an expert-based system in which the interface for the QC analyst is a basic push-button workflow.
The polystyrene functionalization reaction incorporates both an organic and aqueous phase where the required water-soluble polymer is present in the aqueous phase. The analysis must incorporate a preliminary qualitative (classification) model to corroborate that sampling of the correct phase has been conducted for the final analysis.
The ensuing quantitative analysis for the aqueous functionalized polymer will employ a partial least squares for a single variable (PLS1) analysis to identify the percent functionalized polymer with distinct precision and accuracy. This strategy makes sure that the analysis offers a basic, user-friendly system suitable for the multiuser plant analytical laboratory environment.
Experimental
Instrumentation
The Raman spectra are collected via 1064 nm excitation at ca. 495 mW, 180° backscattering geometry, and a spectral range from 250 to 2500 cm-1 with a resolution of 9.5 cm-1 at 1296 nm.
The instrument components are made up of a B&W Tek i-Raman® EX spectrometer with a thermoelectrically-cooled 512-element InGaAs detector array. An enclosed cuvette/vial sample compartment (NR-LVH, B&W Tek) is connected to a fiber optic probe.
The aqueous polymer samples (ca. 10-20 weight percent solids) are passed into borosilicate screw cap vials (height 4.5 cm, outer diameter 1.5 cm, inner diameter 1.1 cm) for the Raman measurements.
Using BWSpec v4.04, data acquisition is completed and includes a dark subtraction. Solutions are measured at an exposure time of 500 ms and 264 accumulations for five minutes of total measurement time.
Software
The BWIQ version 3.0.6 (B&W Tek) multivariable analysis software package was employed to develop the quantitative analyses and qualitative discrimination methods. The software incorporates classification, standard pattern recognition and quantitative chemometric tools.4
Data Analysis
A classification model is utilized to make sure that the sample is comprised of the aqueous layer that contains the polymer instead of the aliphatic organic layer.
The analysis employed to establish the PCA-MD classification model included: sample partition (Kennard-Stone algorithm), spectral preprocessing (mean centering, max value normalization) and variable selection (spectral range), and classification (Principal Component Analysis-Mahalanobis Distance).
The selected parameters for the final chemometric PCA-MD classification model for the measured Raman spectra are displayed in Table 1.
Table 1. Parameters for the PCA-MD classification model for the measured Raman spectra. Source: B&W Tek
| Parameter |
Component |
| Data Pretreatment |
Center |
| Normalization |
Max value normalization |
| Regression |
PCA_MD |
| Principal components |
3 |
| Wavenumber |
650 – 1700 cm-1 |
When the measured Raman spectra have been verified to match that of the water-soluble polymer, a partial least squares model is used to compute the extent of the polymer functionalization.
Sixty unique water-soluble polymers with various degrees of polystyrene functionalization were chosen. The systems differed in terms of functionalization from 65-98%, as established by 1H NMR spectroscopy.
The parameters chosen for the final chemometric PLS1 % quantitation model for the measured Raman spectra of the functionalized water-soluble polymer are displayed in Table 2.
Table 2. Parameters for the PLS1 quantitative model for % functionalized polymer based upon Raman spectra. Source: B&W Tek
| Parameter |
Component |
| Data Pretreatment |
Autoscale |
| Spectral derivative |
Savitzky-Golay second derivative order=3, window size=5 |
| Regression |
PLS1 |
| Principal components |
6 |
| Wavenumber region |
995-1200 cm-1 |
Results and Discussion
An early assessment of the functionalized polymer Raman data shows that the Raman spectra measured with the i-Raman® EX spectrometer of the low, medium and highly functionalized polymer demonstrate excellent specificity in the 900-1300 cm-1 region (see Figure 2).
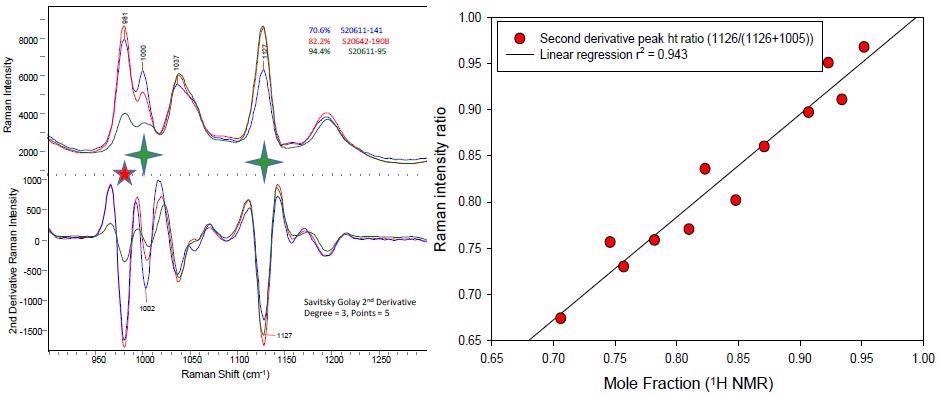
Figure 2. The spectral overlay on the left shows the Raman spectra and their second derivative spectra of three different polymers representative of low, medium and highly functionalized systems. The spectral feature at 981 cm-1 (red star) derives from varying amounts of an inorganic species. The highly diagnostic bands at 1002 and 1132 cm-1 from the starting and functionalized polymer species are identified with a green star). The correlation plot for the simple peak height ratio using the two diagnostic bands versus the 1H NMR determined extent of functionalized polymer is shown on the right.
Image Credit: B&W Tek
An additional feature, noted at 981 cm-1, is caused by an inorganic species. A second derivative spectral pretreatment offers a clear baseline and resolution of the desired aromatic peaks for the initial and functionalized polymer.
A standard peak height ratio analysis is used to assess the quality of the Raman data to identify polymer functionalization. Twelve samples that demonstrated various degrees of polymer functionalization as established by 1H NMR spectroscopy were selected.
Subsequently, the second derivative spectra’s single point peak height concentrations at 1126 and 1005 cm-1 are identified.
The peak height analysis of the two components (i = initial, f = final) utilized the ratio of these two unique bands for component band f divided by the sum of the two component bands (i + f).
The range of this ratio is anticipated to be 0 to 1, where 1 relates to a 100% functionalized polymer.
This standard univariate band ratio analysis generated excellent linearity (see Figure 2), validating the suitability of the Raman spectral data to advance a robust quantitative PLS1 model.
Standard Selection
A well-developed calibration set incorporates the potential variation of future samples. This includes process-induced and environmental variability as well as concentration ranges of constituents.
The PCA-MD classification of the aqueous and organic phase samples incorporated numerous production samples from both phases. The final PLS1 quantitative analysis incorporated over seventy samples from early research lab design-of-experiments, pilot plant batches and production lots that were completely characterized by 1H NMR spectroscopy.
PCA-MD Discrimination Analysis of Organic and Aqueous Phases
Principal component analysis (PCA) is a chemometric technique in which the original spectral data is modified and changed into a new coordinate system, which compresses the information found in the original inter-correlated variables into a few unrelated variables, known as principal components.
The PCA can be utilized to decrease the dimensionality by zeroing out one or more of the small principal components. This leads to a lower-dimensional data projection that conserves the maximum data variance.
This multivariate analysis shows the internal structure of the data in a way that facilitates a straightforward interpretation of the variance in the data. Consequently, it is a practical tool for the visualization of datasets.
In any principal component rotation, the first component explains the maximum proportion of the variance, and subsequent components represent the variance that remains. PCA allows for grouping or clustering the Raman spectra into various classes.
The accumulative ratio plot described quantifies the level of variance as explained in the first N components. In this application, three (N) variables detail 98% of the variance. Cluster analysis methods make up the Raman spectra stepwise, predicated upon the similarity of their spectral features (variables).
A basic distance measurement of the individual spectrum in relation to the various clusters supplies pattern recognition. A conventional distance metric includes the Mahalanobis distance.
Here, the Mahalanobis distance is a statistical tool paired with PCA and is the distance of a point from the center of a primary component cluster. The smaller the Mahalanobis distance, the greater the potential that the point belongs to the cluster.
A basic PCA-MD classification model was effectively developed with 37 calibration and 34 validation Raman spectra. For both the organic and aqueous phases, the model was 100% correct in the classification of the training set Raman spectra.
PLS1-based Quantitative Determination of % Functionalized Polymer
The PLS regression is one of the more commonly known multivariate techniques used in current vibrational spectroscopic methods for quantitative analyses. It is employed to produce a linear model between two matrices, the Raman spectral data and the reference values.
The PLS model established the empirical relationship between the two matrices (X and Y) and facilitates the prediction of a constant property, such as the % polymer functionalization, from the training set.
In the case of the Raman spectra of the standards, the difference in the 1002 cm-1 and the 1127 cm-1 spectral features are closely linked with the % polymer functionalization.
The quantitative model developed for the % functionalized polymer uses a PLS1-based (partial least squares for a single variable) algorithm. The Raman spectrum employs the 995- 1200 cm-1 spectral region, which contains diagnostic bands from both the starting and reacted polymer. Pretreatment of the data included a second derivative.
The general performance of the final quantitative model is outlined in the plot of the predicted (PLS) against the known (1H NMR) % functionalized polymer (see Figure 3); 29 calibration (blue symbols) and 31 validation (red symbols) standards where employed.
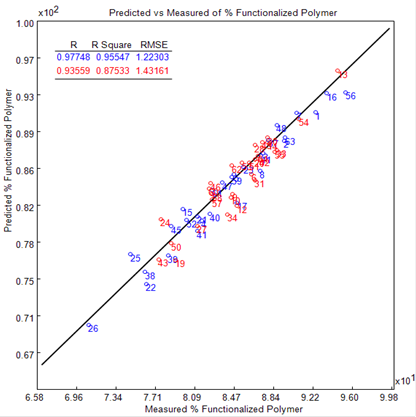
Figure 3. Plot of the predicted (PLS) versus the measured (1H NMR) % functionalized polymer. The blue symbols depict the calibration and the red the validation standards.
Image Credit: B&W Tek
An R2 of 0.95 for the calibration standards and 0.87 for the validation standards demonstrates excellent linearity. The RMSE (root mean square error) is in accordance with the residuals of the calibration data and offers a simple measure of the values predicted.
This was determined for both the calibration (RMSEC) and validation (RMSEP) standards, with an RMSEC of 1.22 and an RMSEP of 1.43. The RME was less than two (<2), showing that the model demonstrates good predictive performance.
PLS1 Quantitative Raman Model Accuracy and Precision
The final model developed offers excellent linearity between the predicted (PLS) and assayed (1H NMR) values for both the validation and calibration standards.
Table 3. Selected statistical measures of merit (precision, accuracy) for the PLS1 quantitative Raman model to determine polymer % functionalization. Source: B&W Tek
| Statistical Metric |
Value |
Comments |
| RMSEP |
1.43% |
Precision: Figure 3 PLS model1 |
| Precision |
0.49% |
Single day, single lot precision Raman |
| (Predicted – Assay) Avg. RMSE |
1.31% |
Accuracy: Figure 4 for 16 additional lots1 |
1Variability contributions from both the Raman and 1H NMR assay.
Table 3 outlines the precision and accuracy performance of the quantitative PLS Raman model. This incorporates the RMSEP from the validation standards (see Figure 4), a conventional single-day and lot precision measurement and ultimately the mean RMSE calculated for 16 subsequent manufactured lots (see Figure 4).
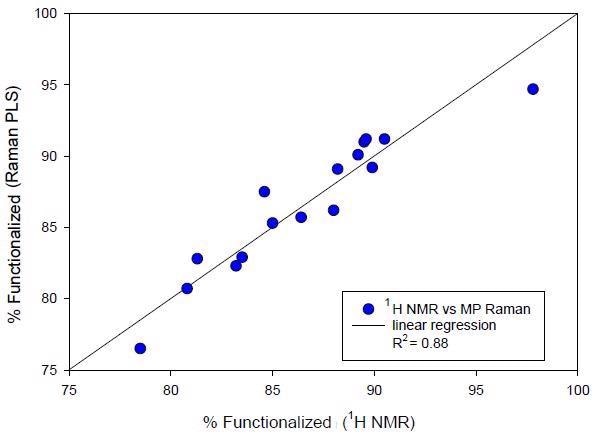
Figure 4. External validation of second manufacturing campaign batches. Raman predicted % functionalized polymer versus NMR determined value.
Image Credit: B&W Tek
The precision of 0.49% and the RMSE of 1.31 to 1.43 indicates the good statistical performance of this quantitative Raman method.
Conclusion
High-quality Raman spectra of an aqueous-based water-soluble polymer (10-20% solids) are measured easily and rapidly when employing the i-Raman® EX spectrometer. The Raman spectrum delivers strong, unique bands for both the initial and fully reacted polymer.
This facilitates the development of a basic, robust quantitative analysis of the percent polymer functionalization utilizing a PLS1 chemometric model with vendor-supplied software (BWIQ). The final Raman method demonstrates exceptional linearity, accuracy and precision.
This Raman method is now routinely used in a multiuser plant quality control (QC) laboratory.
References
- N.J. Everall, J.M. Chalmers, P.R. Griffiths, “Vibrational Spectroscopy of Polymers: Principles and Practice”, John Wiley & Sons, Chichester, 2007
- J.L. Koenig, “Spectroscopy of Polymers” American Chemical Society, Washington, DC, 1991
- P.J. Larkin, “Infrared and Raman Spectroscopy, Principles and Spectral Interpretation, Second Edition”, Elsevier, Cambridge, MA, 2018
- M. Otto, “Chemometrics: Statistics and Computer Application in Analytical Chemistry”, Wiley-VCH Verlag GmbH et Co. KGaA, Weinheim, 2017

This information has been sourced, reviewed and adapted from materials provided by B&W Tek.
For more information on this source, please visit B&W Tek.