Sponsored by HORIBAReviewed by Olivia FrostNov 22 2022
In the first global analysis of all mass-produced plastic ever manufactured, it was determined that approximately 30% of the plastic produced (2500 tons) is still in use or in stock, but 70% of the (around 6300 million tons) has become plastic waste.
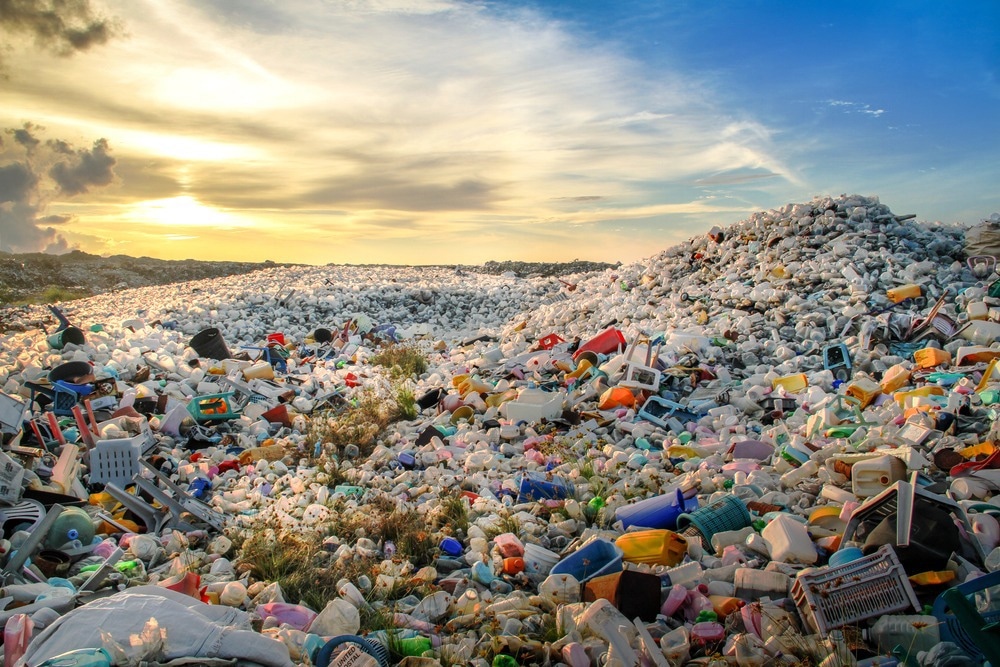
Image Credit: ShutterShock/Mohamed Abdulraheem
Of this waste, only around 9% has been recycled, 12% has been incinerated, and a massive 79% has been dumped in landfill or in the natural environment.
From the landfill, around 8 million tons – more than 45% of the overall plastic produced every year – end up in the ocean and in the environment. What is even more problematic about this huge volume of plastic waste is its long decomposition rate.
A plastic bag can take 20 years to decompose, a plastic bottle can take more than 400 years to decompose, and a fishing net can survive for up to 600 years in the environment. These plastics, over the years, can degrade and generate thousands of smaller particles called micro- and nanoplastics which are a big concern for all of us.
While plastic is important for our industry and economy, it is clear that we need to extensively improve the sustainability of new plastic materials. This article will give an overview of the Raman microscopy techniques applied to the analysis of micro and nanoplastics.
Introduction to Microplastics
There are two different types of microplastic: primary microplastics, which are particles designed to be small, such as cosmetic microbeads, and secondary microplastics, which are formed from the breakdown of larger plastic items.
According to a study that the International Union of Conservation of Nature published in 2017, the main sources of microplastics - synthetic textiles, tires, and city dust - contribute and represent almost 90% of the overall total of plastics.
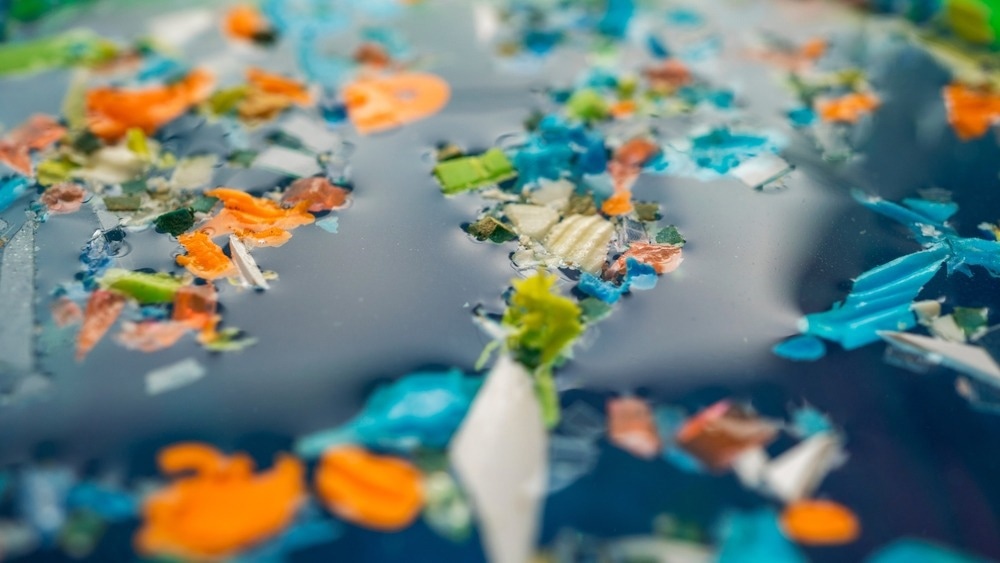
Image Credit: ShutterShock/SIVStockStudio
As mentioned, more than 45% of the global production of plastics end up in the ocean every year, and 79% is accumulated in landfill. Moreover, plastic production in tons is growing yearly due to its importance in our economy, and it is expected to reach 1800 million tons by 2050, so it is crucial to improve the sustainability, recyclability, and reusability of the material.
An additional point of concern is the presence of additives such as plasticizers, flame retardants, unbound chemicals, and reacted residual monomers, which can leach from the plastics or be released during the fermentation process. This poses a threat to human health as micro and nanoplastics can enter the human body through different channels, such as through the skin, the lungs, and the gastrointestinal tract and collect inside the body.
The Evolution of the Research Around Plastic and Microplastic
Interest in plastics research began around 1971 but was mainly related to visible particles such as fishnets and plastic bags and the impact that they were having on marine fauna.
In 2004, the term microplastic was coined and used for the first time in a paper published in Science about microplastics found in sediments. Some years later, several papers started to be published showing the presence of microplastics in foods such as fish, mussels, salts, honey, sugar, and others.
In 2018, microplastics as a topic started to gain interest from the media as detailed studies were starting to identify the presence of microplastics in bottled waters. Moreover, in the same year, microplastics were identified in human stools, demonstrating that microplastics are capable of entering the human body.
In 2020, the Polytechnic University of the Marche, in collaboration with the Hospital Fatebenefratelli of Rome, used Raman microscopy to demonstrate the presence of microplastics with a size below five microns in the placenta, confirming the ability of smaller plastic to bypass its barrier, which opened additional concerns.
Research interests will now move on to nanoplastics, as it has been demonstrated that they are capable of penetrating the capillaries and organs and can easily cross the blood-brain and placenta barrier.
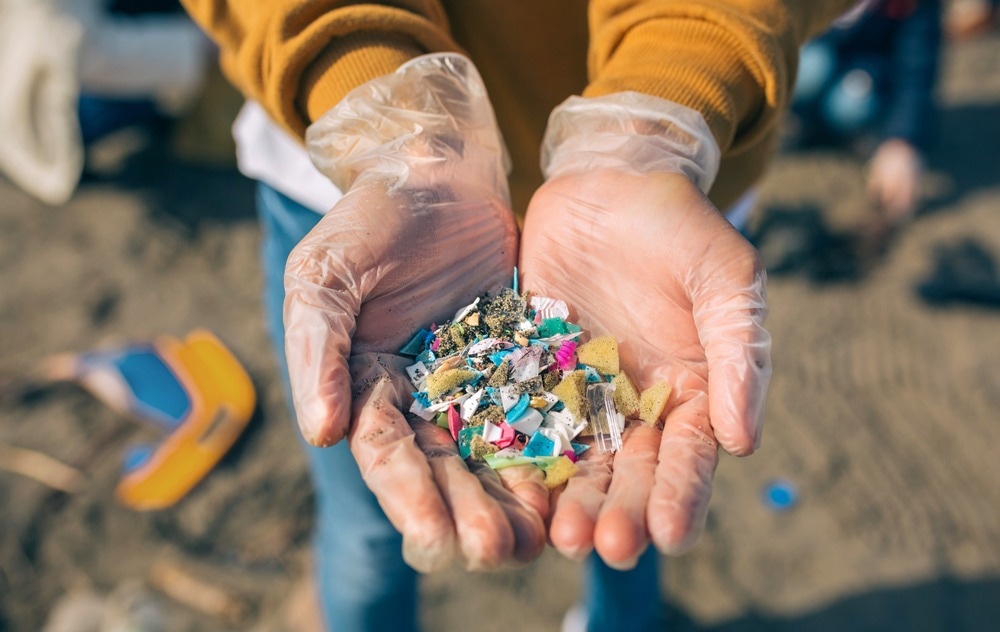
Image Credit: ShutterShock/David Pereiras
A Typical Microplastic Analysis Workflow
Sampling is the first step in a microplastic analysis workflow, and there are several tools available. For example, plankton nets and manta trawls can be used for sampling microplastics in marine water. An Ekman grab sampler samples microplastic in sediment. Another important aspect of the sampling step is the number of different materials that are sampled and where and how to sample them.
The second step is sample preparation, which could involve physical separation, such as size fractioning, followed by a density separation process, as in the case of sediment metrics. This mainly includes several chemical treatments that are necessary when it comes to digesting organic residue, which can affect and interfere with the current chemical identification of the microplastics.
Above all, if spectroscopy techniques such as Raman and infrared are used for identification, there are four main categories of chemical treatment: acids; oxidatives, like with hydrogen peroxide; alkali treatment, like with KOH or NaOH; and different types of enzymatic treatment.
The third step is filtration. After digestion treatment, the solution containing the microplastic is filtered prior to being analyzed with microscopy techniques. An important aspect here is the choice of the current filter. Several are available, all with their pros and cons, but HORIBA's choice is the silicon filter.
Fourth is the chemical and morphological characterization of the microplastic, which can be carried out with different techniques. The most common techniques include Raman microscopy, pyrolysis coupled with gas chromatography, spectrometer, scanning, and electron microscopy. The last step involves data analysis and reporting, which is crucial to present data in the correct way.
A Full Package Solution by HORIBA
HORIBA developed a full-package solution that aims to help customers at each step of the microplastic analysis workflow.
The microplastic booklet is a living document that is updated twice a year to help the reader understand preparation protocol, new regulations and norms, and new technologies. Contributions from key opinion leaders on select topics around microplastics are also included soon.
The second tool is the video Raman matching with NanoGPS technology. This new technology is the best tool for fast and precise calibration, which allows multi-magnification Raman measuring to reach a perfect match between the wide optical field and chemical image. This feature can improve the quality of the data and, of course, speed up the collection time.
The video Raman and NanoGPS can confidently recover the position of each particle, notwithstanding the different objective magnification that is used between the mosaic collection and the Raman measurement.
The final tools included are the software apps available on HORIBA's Raman microscopy platform that support microplastic analysis. Particle Finder is the main software tool for this application and guides the user in an automatic manner through the steps needed to analyze a microplastic.
Particle Finder starts with the acquisition of the optical image and analyses the image to identify all the particles and their position on the filter, followed by acquisition and spectral identification to help identify the microplastic material in question. This final step is data reporting.
The static mode allows for a full optical image to be obtained by stitching together several images and then going through image analysis, Raman acquisition, data analysis, and reporting for all of the images in combination.
The dynamic mode, on the other hand, enables a single image to be obtained, and then each analysis step is then carried out for each image. The additional value of the dynamic mode becomes clear when wanting to acquire a mosaic image with an eye magnification objective because several images need to be stitched together.
In static mode, the time elapsed between the first and the last image of the mosaic can be hours due to the high number of images that must be recorded. The possibility that small particles in the micron and submicron range could have moved from their original position after such a long time of acquisition due to the lab environment or stage movement is pretty high. The dynamic mode provides more reliable results for smaller particles.
Steps of the Particle Finder Workflow
The first step of the workflow is mosaic acquisition. HORIBA's Raman microscope allows for the collection of the optical image in different types of modality, in brightfield mode with visible polarizers in cross-polarization position and in darkfield mode. These modalities give each user the full flexibility needed to better visualize the particle in all conditions.
The second step is automatic image analysis to identify and localize the particle. After the image analysis, a table where all the particles are listed is created. For each particle, all the morphological parameters are available, such as the XY position, XY projection, circularity, brightness, and aspect ratio.
Moreover, users can see a nautical image associated with each particle. On the same table, users can filter the particle they want to chemically identify by means of Raman spectroscopy. Any of the morphological parameters can be used to filter the particle, as well as a combination of more than one parameter. After the collection of the Raman spectrum, a dedicated library can be used for chemical identification.
At the end of the Particle Finder workflow, users get a table where all the particles are analyzed and are listed with their respective optical image, or morphological parameter, the correspondent Raman spectrum, and a color code, which identifies the chemistry of the article.
Users can also display the particle with the corresponding color codes on the mosaic image and get a histogram where the number of particles is divided by the chemistry. Additional tools built into the Particle Finder software provide additional data analysis and reporting flexibility, allowing for deeper analysis after chemical identification.
HORIBA's Approach to Analyzing Nanoplastics
As mentioned previously, nanoplastics are and will become one of the main concerns for humans in the future. Moreover, it is well known that nanoplastics are capable of crossing biological membranes, like the placenta, and influencing cell signals, imposing additional concern. For these reasons, it is essential to have technologies that are able to analyze the morphology and chemistry of nanoplastics.
HORIBA is approaching nanoplastic analysis in two different ways. The first approach is AFM-Raman co-localized analysis, where the AFM part is used like the optical image in the standard Raman microscope and helps to localize the position of the nanoparticle.
The second approach is the combination of scanning electron microscopy and Raman microscopy as a correlative microscopy solution used to localize the position of the particle, and the Raman is used to identify it chemically. The capability to analyze the same particle with the two technologies is enabled by Horibas’s NanoGPS technology solution, which is the heart of the correlative microscopy solution.

This information has been sourced, reviewed and adapted from materials provided by HORIBA.
For more information on this source, please visit HORIBA.