Sponsored by Metrohm AGReviewed by Olivia FrostJun 6 2023
This article demonstrates that sunscreen products’ sun protection factor (SPF) can be determined using visible near-infrared spectroscopy (VisNIRS). This analytical technique offers the advantage of a rapid measurement process with durations of less than 30 seconds, making it well-suited for efficient quality control practices.
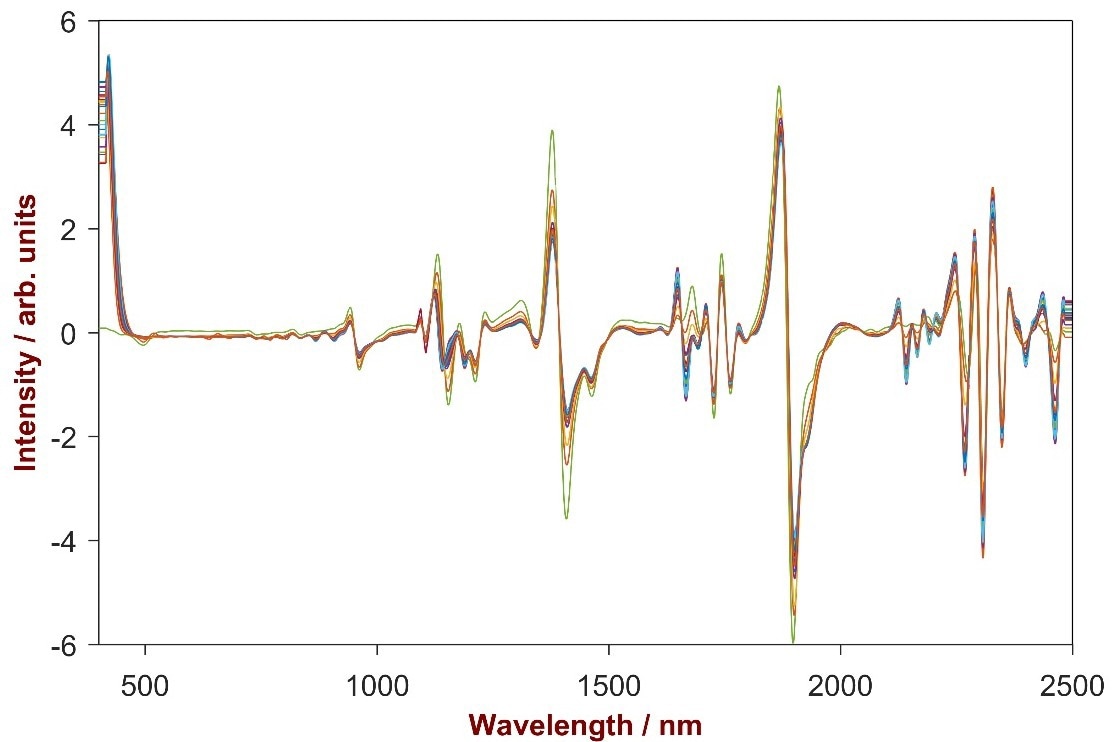
Image Credit: B&W Tek
Skin cancer affects more than two million people annually, with most cases occurring in areas of the body frequently exposed to sunlight.
The harmful effects of solar radiation are mainly due to the presence of unfiltered ultraviolet (UV)-B radiation resulting from ozone layer depletion.
As a result, sunscreen agents are now incorporated into everyday products, such as creams, moisturizers, and lotions.
The efficacy of a sunscreen product is determined by its sun protection factor (SPF), which measures the amount of UV radiation necessary to produce sunburn on protected skin compared to unprotected skin.
The higher the SPF value, the more effective the product prevents skin damage. Organic or inorganic chemical compounds are utilized as active ingredients, which absorb or scatter UV rays, reducing the radiation that reaches the skin.
A combination of various sunscreen filters is necessary to provide complete protection against the entire range of UV wavelengths. However, differing sunscreen regulations across countries result in different sunscreen compositions worldwide.
Determination of the SPF value is crucial to ensure product quality. Traditional methods for determining SPF, such as UV-spectrophotometry and chromatography, require sample preparation steps, including dilution and filtering, before analysis.
In contrast, visible near-infrared spectroscopy (NIRS) is a rapid and non-destructive analytical technique, eliminating sample pre-treatment. This makes it a valuable tool for the fast and efficient quality control of personal care products, particularly in the rapidly evolving sunscreen market.
Experiment
For this particular study, the customer provided 14 distinct sunscreen samples, with sun protection factor values ranging from 10 to 50. Approximately 1 gram of cream was analyzed per sample by applying it to the DS2500 Slurry Cup.
The Gold diffuse reflector with a 1 mm path length was pressed on the sample to ensure even distribution and a constant path length.
The Slurry Cup was then positioned in the Metrohm NIRS DS2500 Analyzer, and the spectra were acquired in transflection mode covering the full wavelength range from 400 nm to 2500 nm (as shown in Tab. 1, Fig. 1, and Fig. 2).
After each measurement, the gold stamp and the Slurry Cup were cleaned using paper towels. The Vision Air 2.0 Complete software package facilitated data acquisition, data management, and developing the quantification method.
Table 1. Used equipment and software. Source: B&W Tek
| Equipment |
Metrohm order code |
| NIRS DS2500 Analyzer |
2.922.0010 |
| DS2500 Slurry Cup |
6.7490.430 |
| NIRS Gold diffuse reflectors, Gold 1 mm |
6.7420.000 |
| Vision Air 2.0 Complete |
6.6072.208 |
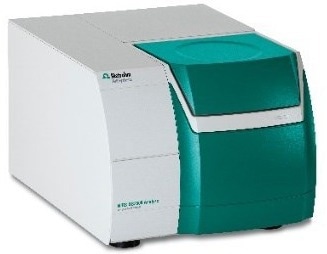
Figure 1. The Metrohm NIRS DS2500 Analyzer was used for spectral data acquisition over the full range from 400 to 2500 nm. Image Credit: B&W Tek
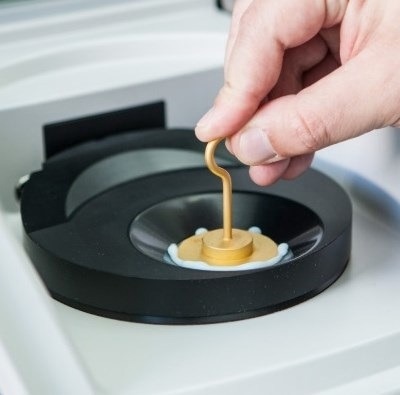
Figure 2. Used accessories: DS2500 Slurry Cup and 1mm Gold Diffuse Reflector. Image Credit: B&W Tek
The acquired spectra were pre-processed with 2nd derivative and standard normal variate (SNV), followed by a Partial Least Squares Regression (PLS) analysis across the entire spectral range.
Results and Discussion
The spectral data of all the samples analyzed are presented in Fig. 3, where a clear correlation between absorbance change and SPF change is evident. Fig. 4 displays the sample spectra after undergoing 2nd derivative and SNV pre-treatment.
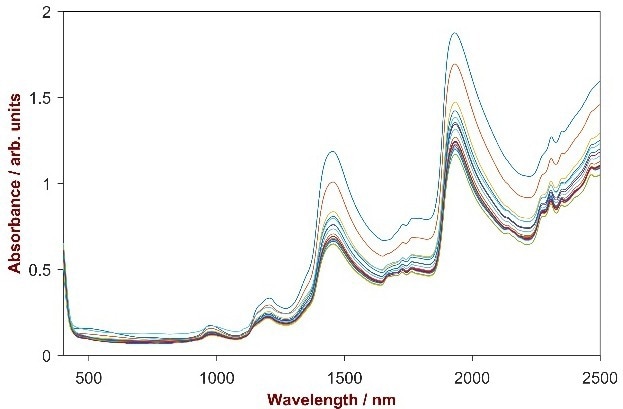
Figure 3. Vis-NIR spectra of 12 sunscreen samples with differing SPF from 10 to 50. Image Credit: B&W Tek
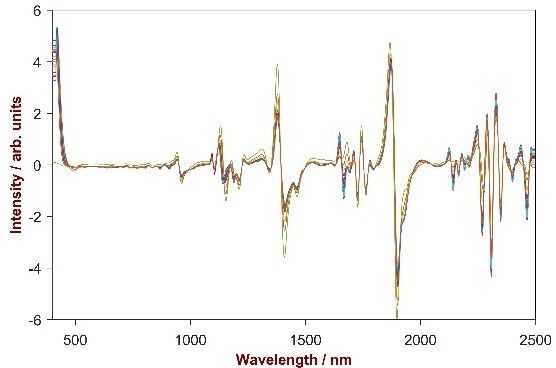
Figure 4. 2nd derivative and SNV pre-treatment of sample spectra. Image Credit: B&W Tek
To confirm the accuracy of the derived quantitative model, an internal cross-validation was conducted on the data set.
The results depicted in Fig. 5 reveal a strong correlation between the reference values provided by the customer (x-axis) and the predicted values (y-axis) obtained from Vis-NIR spectroscopy. The results indicate low standard errors of calibration and cross-validation (SEC, SECV).
Table 2. Results of the quantitative method development. Source: B&W Tek
| . |
. |
| SPF range |
10-50 |
| Method |
PLS |
| Number of factors |
4 |
| Wavelength range |
400-2500 nm |
| Pretreatment |
2nd derivative, SNV |
| SEC |
1.30 |
| SECV |
2.20 |
| R² |
0.9932 |
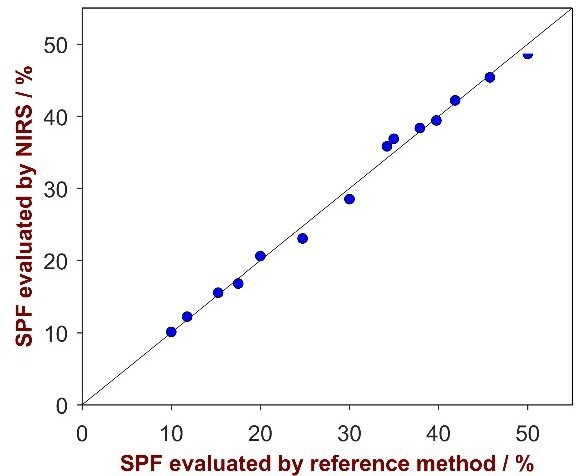
Figure 5. Correlation plot of SPF predicted by Vis-NIRS versus the reference values. A high correlation is observable. Image Credit: B&W Tek
Summary
This article presents the effectiveness of Vis-NIR spectroscopy in determining the sun protection factor (SPF) of creams in less than a minute without sample preparation. The Metrohm NIRS DS2500 Analyzer was used to analyze the samples successfully.
Compared to traditional methods, Vis-NIR spectroscopy provides several advantages, including rapid and reliable results, no sample preparation requirements, and no production of chemical waste.
The accessories can be reused for further measurements after a simple cleaning process. This technique can also be applied to determine other quality parameters, such as moisture and additive content.

This information has been sourced, reviewed and adapted from materials provided by B&W Tek.
For more information on this source, please visit B&W Tek.