In mineral exploration projects, drill core logging and petrographic studies provide the first key pieces of information regarding ore mineralogy, gangue mineral associations, and potential metallurgical complexities.
While detailed, these studies only reveal a limited snapshot of ore fragments, and are not able to capture information at a mining production scale.
The subsequent phase in mineral project evaluation requires a more metallurgical approach. ‘Representative’ ore-grade samples are used to evaluate the required metallurgical flowsheet and the recoverability of the value minerals. These samples are considered representative due to the complexity in determining ores and the need for the geometallurgical process.
Mineral textural analysis using TIMA can be implemented at all stages of a project to obtain quantitative data on the distribution of the natural, or unbroken, ore mineral grain size.
Once this analysis is performed, the grain size distribution can be used to support metallurgical flowsheet development and ore zonation, as well as to diagnose spatial metallurgical variability at later stages.
Method
The flow sheet below shows the sample preparation for textural analysis. The primary objective is to measure ‘unbroken’, non-liberated ore textures, using a crush size suitable for TIMA analysis.
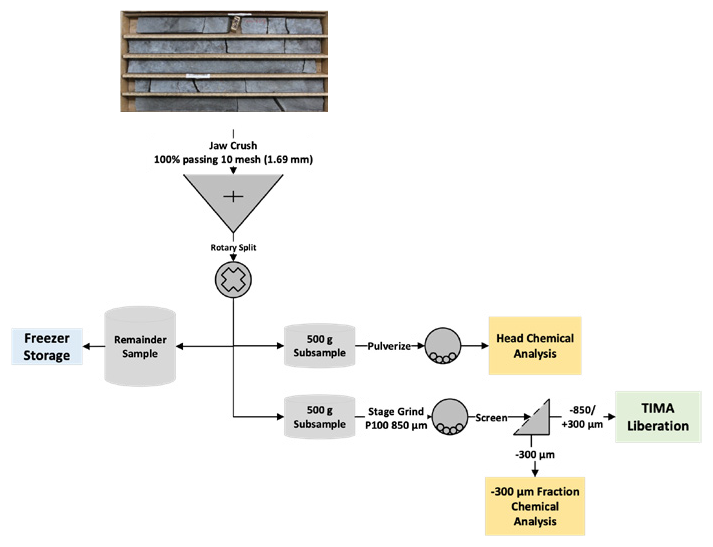
Figure 1. Ore Mineral Textural Testing Flowsheet. Image Credit: TESCAN Group
Particle Mapping
Figure 2 below shows two TIMA particle maps of coarsely crushed zinc ore samples prepared using this methodology.
Each measurement represented a continuous composite of 15 m of drill core. These 25 mm diameter measurements were captured via high-resolution mapping with a 3000 µm field of view and a pixel size of 4 µm.
The TIMA particle maps revealed distinct differences in sample bulk mineralogy and the grain size distribution of sphalerite.
The datasets can be analyzed to extract key ore textural measurements, including the overall sphalerite grain size distribution (which influences the required grind size), and an assessment of the primary sphalerite middling particle types (which affects the metallurgical flowsheet).
These parameters directly influence the primary and regrind size necessary for effective sphalerite liberation and preparation of a high-quality zinc concentrate.
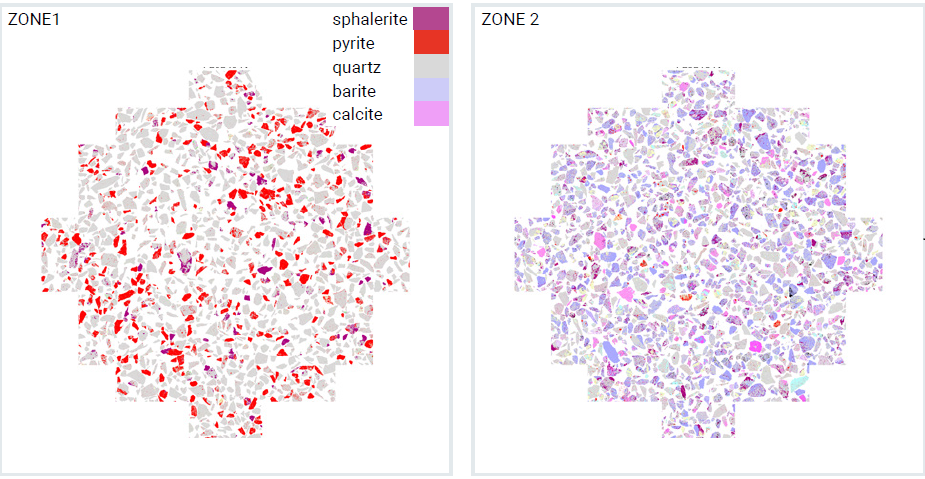
Figure 2. Zn ore particle maps prepared from 15 m interval of crushed core. Maps are 25 mm in diameter. LEFT: Zone 1. RIGHT: Zone 2. Image Credit: TESCAN Group
Sphalerite Grain Size, Liberation, and Gangue Mineral Associations
The two samples' sphalerite grain size differed considerably at a coarse crush size fraction of -850/+300 µm, with Zone 1 and Zone 2 displaying median sizes of 284 µm and 39 µm, respectively.
These differences indicated that ore blocks in Zone 2 will need a finer grind in comparison with those in Zone 1. This difference in grain size is also reflected in their respective sphalerite liberation profiles, with Zone 1 containing 33 % of sphalerite in particles with 80 % liberation or higher, whereas this value is only 1 % in Zone 2.
The two samples also had large variations in their sphalerite gangue mineral middling associations. Zone 1 included liberated sphalerite and middlings (or binary particles) combined with quartz and pyrite. Zone 2 was dominated by sphalerite middlings associated with quartz and barite, featuring a high proportion of complex particles where sphalerite was linked with other minerals.
Moreover, sphalerite constituted only 34 % of all particles in Zone 1 but was present in 86 % of all particles in Zone 2. This indicated that even with a coarse particle size, a substantial number of non-mineralized grains may be separated or rejected from the sphalerite-bearing grains in Zone 1.
The middling groupings illustrated here were generated using TIMA categorizers, with particle compositions defined through specific functions.
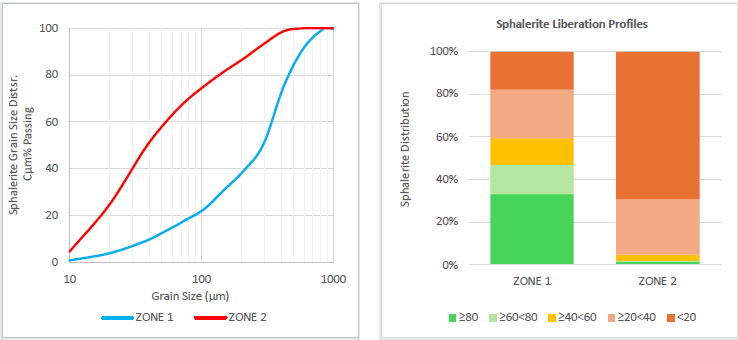
Figure 3. LEFT: Sphalerite grain size distribution. RIGHT: Sphalerite liberation by class. Image Credit: TESCAN Group
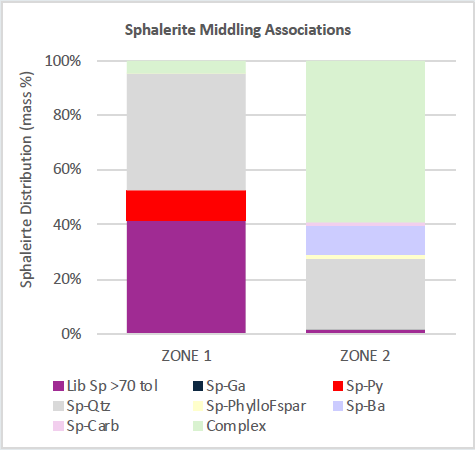
Figure 4. Key sphalerite gangue mineral middling associations in Zone 1 and 2. Image Credit: TESCAN Group
The figures below show examples of sphalerite-gangue middling particles in Zones 1 and 2, clearly representing the textural differences.
Each segment of the chart measures 400 µm across. These particles can be identified through careful inspection of particle maps.
The sphalerite middling particles were further analyzed to assess their true sphalerite grain size distribution within each category.
This analysis is essential in the regrind process, as middlings containing pyrite will be directed to a rougher concentrate, whereas those in non-sulphide gangue may report to the tail and require subsequent regrinding.
Both zones exhibited a population of sphalerite grains ranging from 210 µm (65 mesh) to 841 µm (20 mesh). However, Zone 2 contained a significantly higher population of fine sphalerite particles measuring less than 105 µm (150 mesh), particularly within the complex middlings class.
The p20 (20 % passing) size for sphalerite in complex middlings was found to be approximately 100 µm and 40 µm in Zones 1 and 2, respectively, indicating the potential regrind size requirements.
Conclusions
TIMA analysis of crushed intervals of drill core can reveal valuable insights into the mineralogical and ore textural characteristics at a mining scale.
The study illustrated here demonstrates a methodology for measuring key mineral indices, including ore grain size distribution, mineral abundance, middling associations liberation, and grain size distribution by middling type, while the metallurgical flowsheet is still being developed.
This approach can be employed in early-stage projects to provide initial insights into the variability of metallurgical response.
It can also be used in geometallurgical programs to inform decisions regarding flowsheet options, ore blending strategies, and optimal grind/regrind sizes.
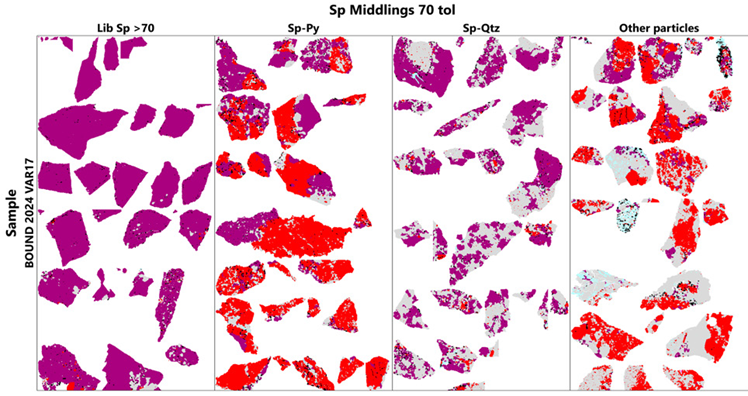
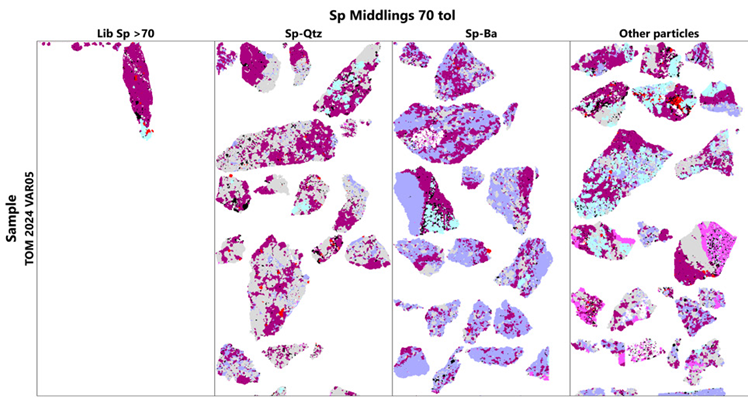
Figure 5. Sphalerite middling maps. Sphalerite liberation tolerance was set to 70%. TOP: Zone 1. BOTTOM: Zone 2. Image Credit: TESCAN Group
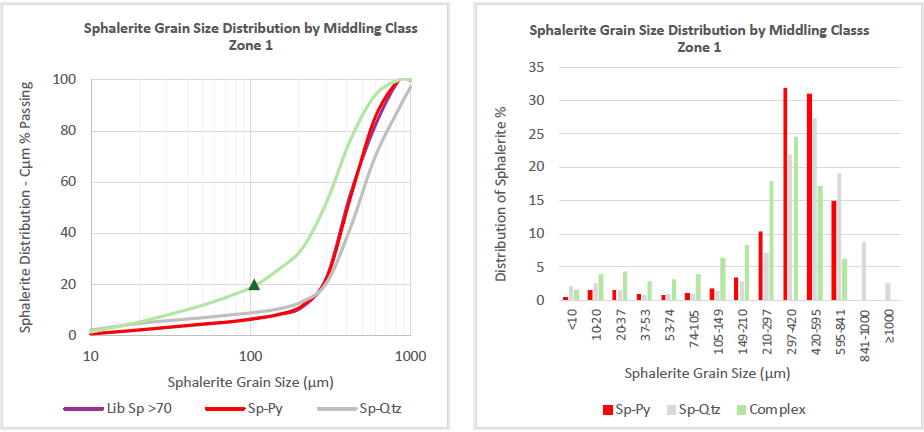
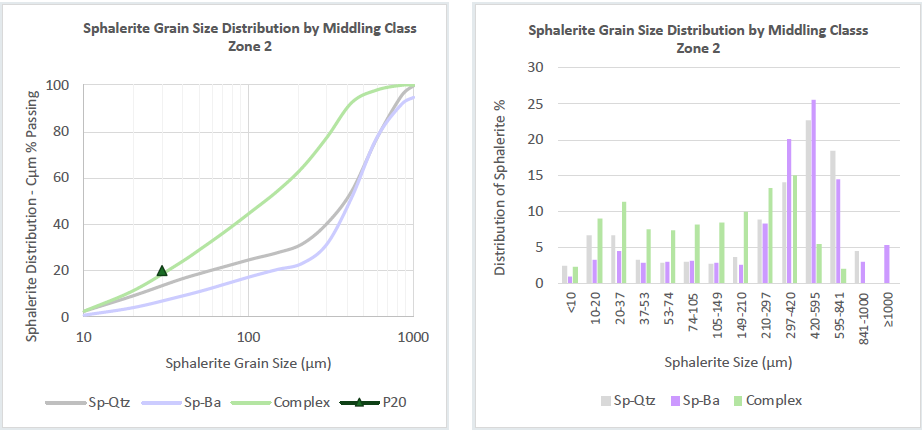
Figure 6. Sphalerite grain size distribution per middling class. Image Credit: TESCAN Group

This information has been sourced, reviewed and adapted from materials provided by TESCAN Group.
For more information on this source, please visit TESCAN Group.