Engineered Nanoparticles (ENPs) are gaining interest in a variety of industrial and commercial products, such as food, cosmetics, and pharmaceuticals. The physical properties of bulk materials will not change with respect to their size, but the size of nanoparticles often control their physical and chemical properties.
The size of nanoparticles need to be accurately and comprehensively characterized in order to control their properties and understand their potential in new applications. Shape, aggregation, and zeta potential are the other essential parameters for the development, formulation, optimization, quality control and toxicology of nanoparticles. These parameters can be determined using various analytical techniques, each of which has their own advantages and disadvantages.
Light scattering-based nanoparticle characterization tools such as dynamic (DLS), multi-angle (MALS) and electrophoretic (ELS) can determine shape or conformation, size and size distributions, and propensity for flocculation or aggregation.
Auxiliary methods that improve and support light scattering are field-flow fractionation (FFF), which seperates nanoparticles based on their size before analysis, and inductively-coupled plasma mass spectrometry (ICP-MS) for elemental composition analysis.
The Nanoparticle Characterization Challenge
In nanoparticle engineering, a key challenge encountered is the sensitivity of the properties of nanoparticles to slight variations between seemingly similar particles. Therefore, ENPs produced by nominally equivalent processes need to be comprehensively characterized to discover if they are actually identical.
The properties of nanoparticles can change as a function of time, as they may be not in equilibrium with their environment. Small differences in the surrounding media can lead to particle aggregation, size changes, and reaction with their environment to absorb or oxidize contaminants.
Obtaining an understanding about the time dependence of these properties is crucial for manufacturing and product stability, and for storage, environmental and health impacts.
The regulations controlling the use of ENPs are yet to be fully defined. The existing guidance by the US Environmental Protection Agency (EPA) demands “…manufacturers of new (nanoparticle) chemical substances to provide specific information to the Agency for review prior to manufacturing chemicals or introducing them into commerce.”
It is recommended to have a comprehensive approach to analysis, especially with relative to particle size that affects the critical characteristics of ENP behavior such as uptake by an organism or rate of diffusion.
A Light Scattering Toolkit
Light scattering is available in different forms, each of which help to obtain different insights into the properties of nanoparticles. DLS is the most common form of light scattering for the analysis of nanoparticles. MALS and ELS are the more sophisticated forms.
DLS
DLS is a fast, low resolution method for performing diffusion coefficient measurements and thus hydrodynamic size (rh) of nanoparticles in suspension or solution.
Using the diffusion coefficients measured, it is possible to estimate particle size and coarse size distributions between a radius of below 0.2 nm and up to thousands of nm within seconds to minutes, often with no dilution or additional sample handling steps beyond pipetting into a microwell plate or cuvette.
DLS is ideal for all forms of ENPs, irrespective of the material and the optical properties, such as organic, dielectric, semiconducting, and metallic.
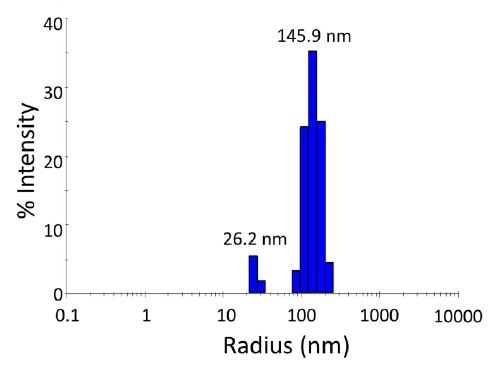
Figure 1. Size distribution from batch (unfractionated) dynamic light scattering (DLS) measurement of semiconducting nanoparticles, exhibiting a bimodal population. Scattering intensity is approximately proportional to the 6th power of the radius, so while the peak at 145.9 nm appears much larger in the scattering intensity than the 26 nm peak, in terms of mass content it is actually much smaller.
Fluorescing nanoparticles pose a challenge that can be addressed by installing narrow-band fluorescence-blocking filters or changing the laser wavelength. Traditional DLS is performed in single-sample cuvettes in tools such as the DynaPro® NanoStar®.
Conversely, a more sophisticated system can automatically measure dozens or hundreds of samples in microwell plates, drastically improving the productivity and throughput for ENP characterization.
Wyatt Technology’s DynaPro Plate Reader II can perform in situ DLS measurements in standard microwell plates holding 96, 384 and even 1536 samples and can analyze hundreds or thousands of samples in a day to screen various solution conditions for optimal stability and other properties. Another application is the optimization of the process conditions of drug nanoparticles made by acoustic milling.
MALS
MALS determines a different measure of size and the root mean square radius rg (from 10 to ~ 500 nm) of ENPs utilizing their anisotropic (i.e., angle-dependent) scattering behavior.
Unfractionated MALS measurements cannot establish a size distribution, unlike DLS, but can establish a z-averaged size of the overall population of particles in solution. However, MALS is ideal in performing measurements in flowing systems, like the field-flow-fractionation (FFF) system, determining high-resolution size distributions with the help of FFF.
The combination of rh and rg provides the shape factor ρ = rg/rh, which is a good predictor of shape and conformation, for example, the ellipticity of an ENP or differentiating between a shell vs. filled sphere. For larger particles like carbon nanotubes, the angular intensity distribution reveals the rod-like length and shape.
Wyatt’s DAWN® HELEOS II® can integrate an embedded WyattQELS™ DLS detection module for improved capabilities such as ρ analysis. It is the most versatile and widely used MALS detector for ENP characterization with the aid of FFF.
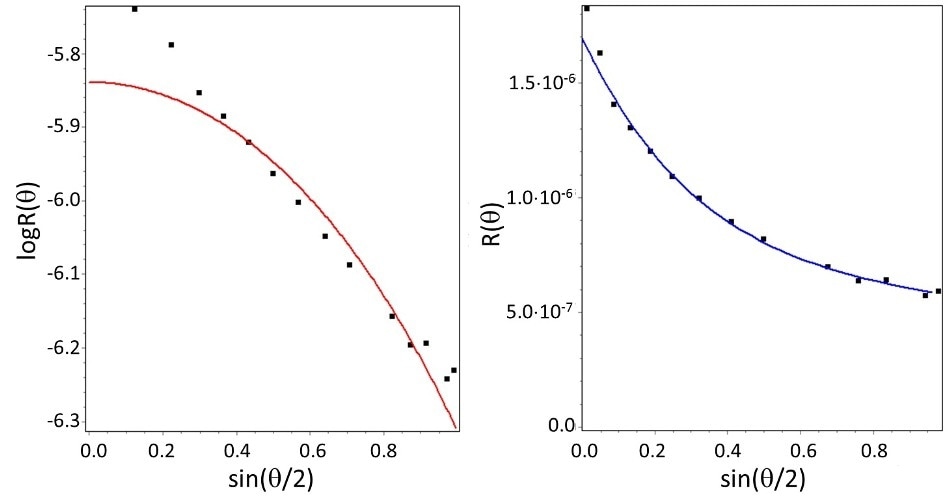
Figure 2. Angular distribution of scattered intensity for carbon nanotubes as determined by multi-angle light scattering (MALS), and fits to two shape models. Left: best fit to sphere model. Right: best fit to rod model. While the sphere model does not fit the data, the rod model does, indicating a half-length of 330 nm.
ELS
ELS is used to determine the charge on an ENP suspended in a fluid, typically presented as the zeta potential. This technique involves the measurement of drift and electrophoretic mobility of a nanoparticle upon exposure to an external electric field using the laser Doppler technique.
A DLS detector is a standard component in most of the ELS instruments in order to measure size and mobility, and calculate zeta potential from mobility, size and solution conductivity. Like most colloidal systems, the zeta potential of ENPs is a good indicator of their stability against flocculation or aggregation and a predictor of surface modifications that may have an impact on charge.
Wyatt’s Möbius® instrument can be used for automated measurement of size and zeta potential by enabling the connection to an autosampler. This combination can perform dozens of measurements automatically, enabling concurrent ELS and DLS measurements to study potential sample degradation caused by the application of an electric field.
By observing the changes in particle size distribution using DLS, formulators can evaluate gross protein aggregation across a dynamic temperature range, pH, or following critical aspects of the formulation process.
For example, the DynaPro Plate Reader II was used to measure the particle size distribution of two monoclonal antibody (mAb) formulations with and without sucrose, before and after lyophilization. The reconstituted lyophilized samples had the same concentration of the pre-lyophilized solutions.
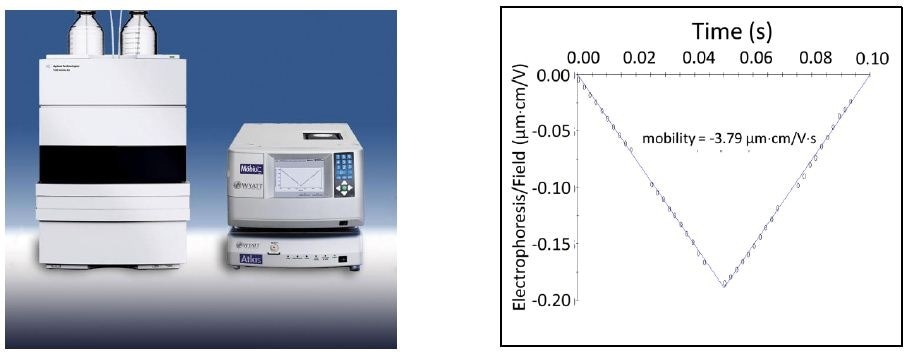
Figure 3. Left: electrophoretic light scattering (ELS) is usually carried out in cuvette-like cells, but when automation of many samples is desired a flow-cell-based instrument with simultaneous ELS and dynamic light scattering capability may be connected to an autosampler. Bottom: graph shows drift vs time under a field of alternating polarity, and the fitted mobility result.
The Key to High Resolution: Field-Flow Fractionation
Batch (unfractionated) measurements can at best provide low-resolution size distributions. A means of sensitive size-based separation upstream of the light scattering detector is needed to obtain high-resolution distributions.
Various types of FFF methodology have been developed for fractionating simple to complex colloidal sample mixtures. Asymmetric-flow field-flow fractionation (AF4) is the well-established form of FFF technology, which separates samples in the size of 1 - 1000 nm in suspension or solution within an open channel using liquid forces alone. After fractionation, the eluting material can then be analyzed for elemental composition, size, and other properties using a range of online detectors.
In AF4, fractionation of the sample relies entirely on hydrodynamic size, and happens due to the competing effects of drift within a flowing channel, under an applied field and diffusion. The AF4 ‘field’ is a cross-flow field, with a semi-permeable membrane as the bottom surface of the channel.
The solvent flows through the membrane, drawing particles to accumulate near the membrane. However, the particles are transported away from the membrane into the channel due to diffusion.
If the size of a particle is smaller, then it diffuses farther. Particles are separated when ‘channel’ flow is applied parallel to the membrane, because the laminar flow profile is further from the membrane when it is subject to higher velocity (Figure 4). The ratio of cross-flow to channel flow can be adjusted to balance the resolution and overall size range of the fractionation process.
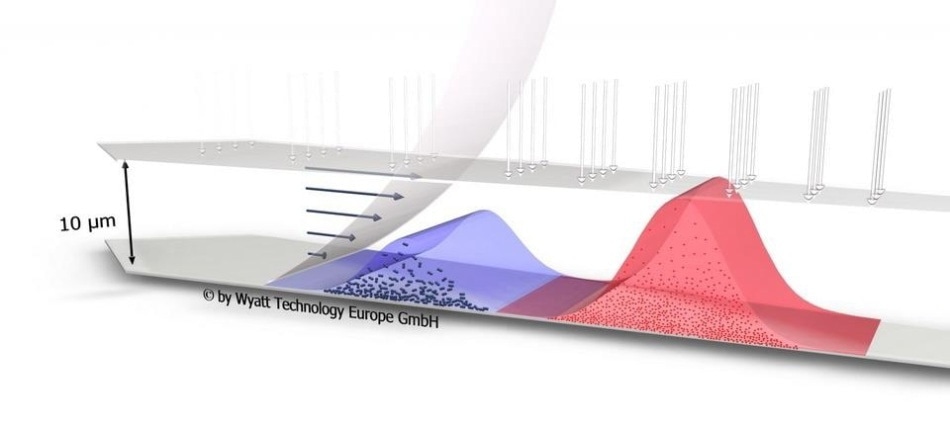
Figure 4. Process of fractionation in an AF4 flat channel during sample elution with cross-flow and channel flow.
Principally, size vs AF4 elution time can be calibrated, but is not a reliable measurement compared to the results obtained with the integration of MALS and/or DLS detectors downstream. Unfractionated DLS at best differentiates particles that vary in size by 3 - 5x, whereas AF4-MALS and AF4-DLS are capable of characterizing accurately particles that vary in size by just a few percent, and helping in the determination of shape.
Unlike imaging methods, such as electron microscopy, AF4-MALS/DLS is not able to yield highly detailed shape and morphology but can provide a statically valid sample to measure reliable size distributions.
A chromatogram for a poly ethylene glycol suspension of gold nanoparticles (AuNP) is illustrated in Figure 5. Wyatt’s AF4 system, the Eclipse DualTec™ was used to fractionate individual AuNPs, nominally 10, 20, 30, 40, and 60 nm, and were characterized online using DLS (DAWN HELEOS II with WyattQELS).
Every fraction was clearly resolved and successfully separated. Separation and characterization of AuNPs by AF4, MALS and DLS is the subject of intense research.
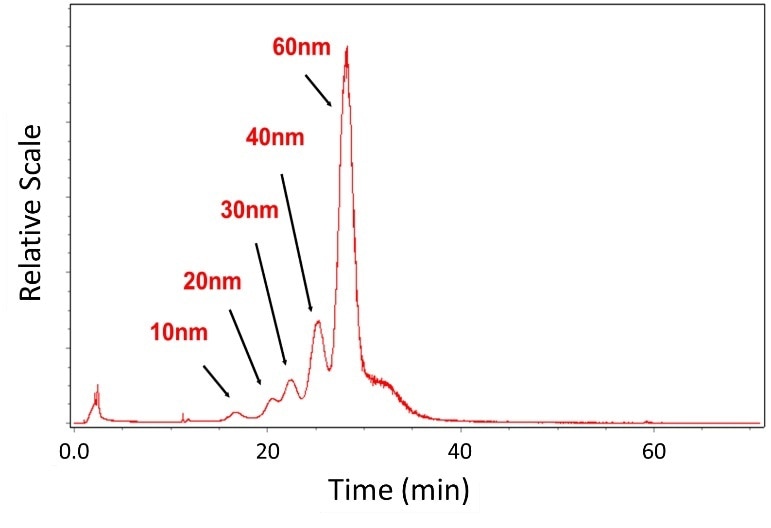
Figure 5. Fractionation and characterization of gold nanoparticles in aqueous solution with FFF and DLS.
Light scattering is an effective method to characterize nanoparticles. However, it has limited reliability at ultra-low concentrations of smaller particles, where corroboration with an additional particle sizing method may be required.
Single-particle inductively-coupled mass spectroscopy (SPICP-MS) is another method used to determine the size of metallic nanoparticles such as silver or gold, as well as their composition. AF4 + SPICP-MS has been employed to investigate the size and chemical composition of nanoparticles present in foods, as well as the type of metals related to nanoparticulate fractions collected from natural sources such as streams and lakes.
The combined utility of AF4-LS-ICP-MS is especially powerful in evaluating the size and composition of nanoparticles in the field of food packaging applications. Silver nanoparticles have demonstrated to be effective antimicrobial additives, and therefore some food packaging containers are now being fabricated with these nanoparticles added into their liners to prevent food spoilage.
Using AF4-LS-ICP-MS, food scientists can sample the food items to confirm whether the nanoparticles remain in the liners or have reached the food item packed in the container.
Combining AF4 with ELS
Wyatt has recently demonstrated a novel characterization scheme in its lab by integrating AF4 separation and ELS to measure nanoparticle electrophoretic mobility by size with superior resolution. The AF4-ELS apparatus included a Möbius ELS/DLS instrument, an Eclipse Dualtec AF4 system, and an Optilab T-rEX refractive index detector (Wyatt Technology) to determine concentration.
The results of AF4 separation + flowing ELS and DLS measurements of polystyrene latex nanoparticle standards as well as particle concentrations are presented in Figure 6. The heterogeneity of the 50 nm diameter standard is visible, along with the inverse relationship between the size and the mobility. AF4-ELS has the potential to effectively characterize heterogeneous nanoparticle samples.
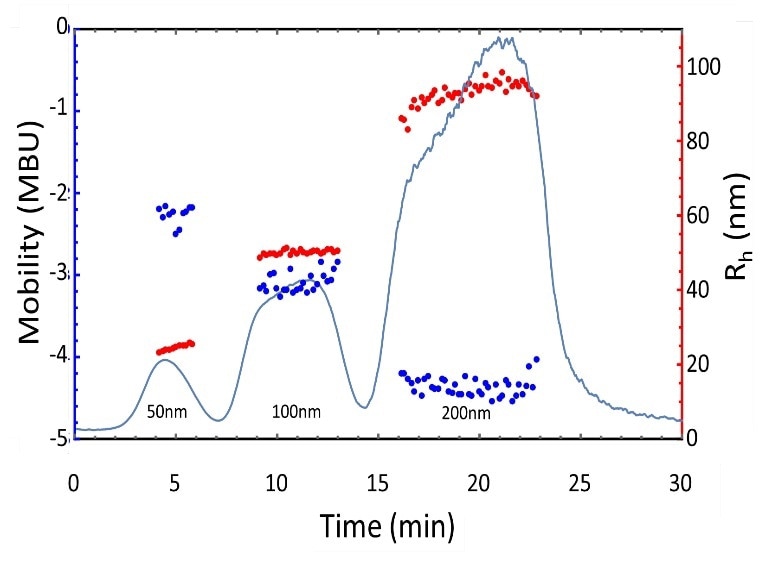
Figure 6. Electrophoretic mobility and size measurements of polystyrene latex nanoparticle standards separated by AF4.
Conclusion
The light scattering toolkit provides an essential analytical tool for nanoparticle characterization, combined with unprecedented levels of automation, resolution, and sensitivity. In the unfractionated mode, DLS, MALS, and ELS.
FFF technology is highly advantageous when the fractionation is coupled to online detection, including DLS and MALS analysis to determine size and conformation.
Additional data about the sample can be obtained when additional downstream detection such as ELS or ICP-MS, or spectroscopic detectors such as UV/Vis/NIR absorption or fluorescence are incorporated. This versatile suite of instruments is important to engineers and researchers working in nanoparticle characterization.

This information has been sourced, reviewed and adapted from materials provided by Wyatt Technology.
For more information on this source, please visit Wyatt Technology.