Spectroscopists trained in laboratory techniques have often viewed NIR as a less-than-useful spectral region that exists to fill the gap between the IR and UV/VIS regions. Compared to IR peaks, NIR peaks are overlapped, broad, and much weaker. However, despite this fact, it is not known why NIR is extensively being used in process analysis.
In the 1980s, NIR became popular because of the advent of sensitive detectors, fiber optics, and bright light sources. This technique has also solved some difficult characteristics of IR, because NIR optical paths via liquid samples can be millimeters or even centimeters, instead of microns. Therefore, the first commercial fiber-optic spectrophotometers were launched in the 1980s.
The key to these advancements lies in the ability to bring a fiber-optic probe (the sampling interface) to the process while distantly placing the electronics—that is, ignition sources—away from dangerous environments. This also meant that the conventional, time-intensive method of gathering (“grab”) samples and bringing them back to the lab for analysis can possibly be substituted by continuous “on-line” measurements without exposing workers to potentially harmful chemicals. In turn, continuous on-line measurements lead to enhanced product quality, less rework of off-target material, more responsive process control for better production yield, and improved worker safety. It started to change the paradigm by directly determining the chemistry, instead of inferring it from pressure, temperature, flow, and fluid level. In addition, mathematical techniques using multivariate statistics are usually needed to study the slight NIR spectral changes among the overlapped peaks. This field of multivariate statistical techniques for chemical analysis is called chemometrics.(2) Perhaps, partial least-squares (PLS) are the most extensively used chemometric techniques applied to NIR data(3) and these became popular in the 1980s as computers improved.
While significant developments have been made since the launch of the first process scanning spectrophotometers, these methods assume that a complete spectrum is needed to overcome the analytical issue. However, this assumption comes with a large price tag and requires personnel with chemometrics expertise. However, in many cases, just a few wavelengths are needed to provide an acceptable calibration. Here, multiple linear regression (MLR) method can be used for selecting a few wavelengths from a complete spectrum analysis.(4)
Near-IR Spectra
Figure 1 shows spectra of gasoline, demonstrating the properties of NIR spectra. These spectra represent light transmission through a path length of 1 cm of gasoline.
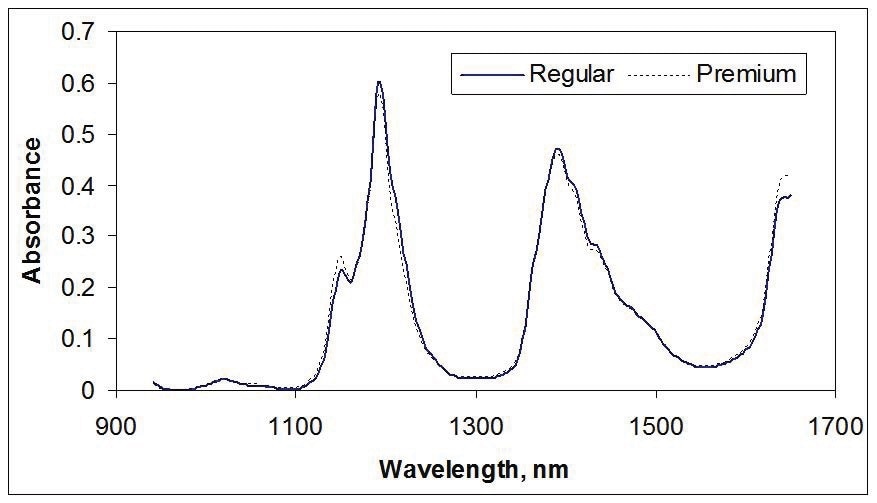
Figure 1. NIR spectra of gasoline
NIR is often used for measuring trace amounts of moisture near 1900 nm, as illustrated in the spectra of tetrahydrofuran in Figure 2.
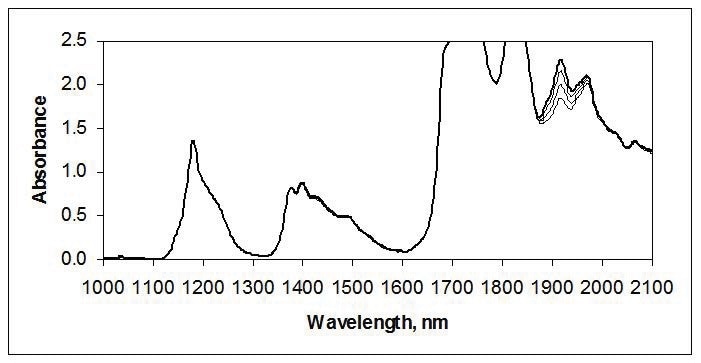
Figure 2. Water in tetrahydrofuran
NIR reflectance measurements have been extensively used for solids in agricultural, food, pharmaceutical, textile, and other industries. Reflectance measurements are strongly affected by the sample’s particle size, size distribution, and uniformity. As a result, much of the evolution of near-IR reflectance has been directed toward reducing these physical effects using computational corrections, taking the average of many measurement points, as well as using larger areas of illumination. Figure 3 shows the NIR spectrum of wheat flour.
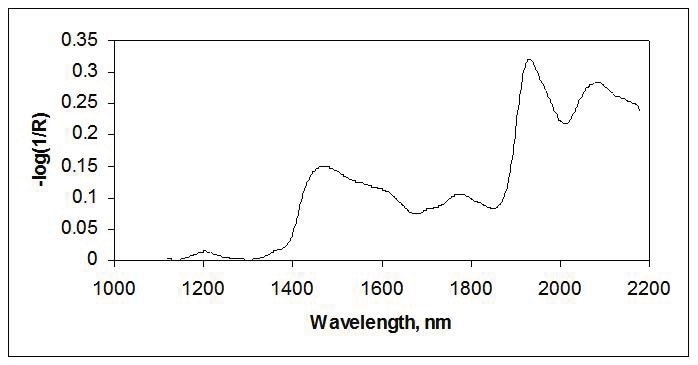
Figure 3. Reflectance spectra of flour
Data Analysis
Partial Least-Squares (PLS)
The powerful, multivariate quantitative technique—PLS—is often used for predicting the properties from NIR spectra.(2,3) By using eigenvalues and eigenvectors, PLS executes a decomposition of the spectral and constituent concentration data at the same time. The term “factor” is used for describing a linear combination of spectral data. The first factor determined from the decomposition includes the most difference in the data. This factor is subsequently removed, and a second factor is determined that contains a smaller percentage of the overall variation and so on, all guided by the constituent concentrations. By eliminating less critical factors, the PLS method eliminates differences in the data that do not provide any valuable information in ascertaining a calibration. However, a high level is required to interpret and apply the PLS programs, an expertise lacked by many companies.
Multiple Linear Regression (MLR)
MLR tries to choose a sequence of wavelengths from the calibration samples that reduce the sum of the squares of the residuals between the actual and predicted concentrations.MLR is simply used to find the set of wavelengths that create the “best” fit, but this may not be the best approach because it may be strongly affected by noise in that specific data set.
Calibration Transfer Between Instruments
No two instruments are identical. Among instruments, the most critical difference is perhaps along the wavelength scale. Hence, calibration transfer methodologies have been devised to install and modify models in latest instruments without the need to rerun all calibration samples.
Fiber-Optic Instrumentation and Requirements
Scanning Spectrophotometers
Scanning process instruments depend on projecting light from a bundle of optical fibers or from an optical fiber onto a diffraction grating. Through this grating, the light gets dispersed into its constituent wavelengths. The grating is mechanically rotated so that a narrow set of wavelengths is sequentially permitted to pass through a narrow slit. However, the need for faster collection times places a considerable burden upon moving the grating rapidly and knowing which wavelength relates to a specific signal. This is especially vital because PLS models usually need sub-nanometer wavelength stability over time.
Fourier Transform Spectrophotometers (FT-NIR)
In FT-NIR spectrophotometer, a beam splitter is used for separating the incoming light beam into two beams, which are subsequently recombined, directed into an optical fiber, and then sent to the sample.(5) FT-NIR has a “multiplex” advantage over scanning instruments and also a greater wavelength resolution. However, despite the design advancements, FT-NIR technology features a moving part and is prone to vibrations.
Acousto-Optic Tunable Filters (AOTF)
AOTF does not need a moving part, unlike the scanning instruments. Instead, light is directed into a TeO2 crystal. By using a piezoelectric material adhered to the crystal, high-frequency acoustic wave in the radio frequency range is coupled into the crystal. These acoustic waves rapidly propagate via the crystal, then interact with the broadband light, and finally produce two monochromatic beams of light, with each light polarized in a different direction. It is possible to program AOTF to choose any set of wavelengths. Therefore, more time can be spent in regions of interest or on specific peaks, and less time can be spent in spectral regions that contain little or no useful data.
Photodiode Array Spectrophotometers(PDA)
Perhaps, PDA is the most intuitively obvious method of obtaining NIR spectra. This method involves placing a compact, linear array of detectors at a suitable distance from a diffraction grating to study the entire set of wavelengths. However, while silicon (Si) PDAs have been commercially available for some time, they can only be applied below approximately 1000 nm.
Fixed Filter Photometers
Historically, fixed filter photometers can analyze multiple NIR wavelengths and they operated by passing light through a sample cell inside the instrument. This sample is constantly extracted from the process and pumped via this cell. Light is subsequently passed through a rotating wheel that contained several optical interference filters, which, in turn, permit light only within a narrow wavelength range, usually 10–20 nm wide to pass. In this manner, various wavelengths are chosen and rotated in front of a NIR detector. Fiber optics has been recently incorporated into photometers to realize the benefits described earlier. Equipped with a microprocessor, process NIR photometers can monitor a wide range of applications using multiple wavelengths and MLR.
Fiber Optic Multiplexing
Another major technological development for process analysis is fiber optic multiplexing. With this technique, a number of fiber-optic probes can be sequentially examined with a single instrument, thus reducing the cost per point of analysis.
Enclosures for the Process Environment
In the production environment, the presence of process NIR spectrophotometers and photometers can pose explosion or fire hazards if there are flammable vapors. Hence, NIR process equipment will probably need exclusive enclosures to eliminate or reduce such risks to equipment and personnel. In view of this, hazardous area classifications for North America are categorized into Class, Division, and Group under the NFPA 496:1993 standard. Standard classifications for NIR analyzers include(6) Class 1, Division 1, Groups B-D; Class 1, Division 2, Groups, B-D; and General Purpose, NEMA 4.
Fiber Optics and Fiber-Optic Probes
The aforementioned advancements in NIR instrumentation needed concomitant developments in fiber-optic probe technology. Even the most stable spectrometer will prove useless if the fiber-optic probe attached to it falls apart. Therefore, process probes must endure the rigors of the manufacturing environment, such as mechanical vibrations, aggressive chemicals, high pressures, and high temperatures, and usually, combinations of the above.
Transmission Probes
Insertion Probes
These probes are long metal rods measuring 18–25 mm (¾–1 inch) in diameter and 9–91 cm (6–36 inch)in length. Insertion probes can usually tolerate temperatures up to 250 °C and 1000 psi (7 MPa). While they are costlier than flow probes by 50%–100%, most often, they provide the only way to continuously track reactions in a reactor.
Flow Cells
Flow cells are probes that are specifically developed for slip (side) streams, which are actually fast bypass liquid streams having smaller diameter piping. The majority of rugged flow cells feature primary O-ring seals and sapphire windows. Using sample ports and valves, the side stream can be closed off and drained and the clean port on the cell can be removed for cleaning the optics easily.
Reflectance Probes
Used similarly like the insertion probes, reflectance probes often use multiple fibers to render greater intensity and larger areas of illumination for collecting the light reflected from the sample. There are many commercially available configurations.
Internal Reflectance Probes
Attenuated total internal reflectance, or ATR, is used for measuring the liquid phase in multiphase samples that contain light-scattering centers, for example, bubbles in foams and particles in slurries. This technique has been successfully applied in the UV and IR where the absorption from electronic transitions and vibrations, respectively, are intense. However, this is not the case in the NIR. The hazards of using ATR in the process is that surfaces can become coated and inhibit the ATR probe from sensing variations in bulk chemistry.
Fiber Optics
Multi-mode optical fibers are available for NIR. Two types of fibers—called low-OH fibers and high-OH fibers—are used with process analyzers. Low-OH fibers are used in the NIR for reducing the absorption caused by the fiber itself in the critical O-H regions near 1450 nm and above 1900 nm. High-OH fibers are less prone to solarization or darkening upon exposure to UV light, and hence they are used in the UV/VIS. Their higher OH content prevents their use in most NIR applications. Light follows many different paths via the fiber and is slightly attenuated over long distances.
Organizational Issues
This article has clearly focused upon the technologies involved in process NIR, but it may not be apparent that effective implementation depends more upon corporate organizational problems than upon the instrument itself. Process analytical chemistry is indeed highly multi-disciplinary.(7) Moreover, choosing a costly nine-probe NIR spectrophotometer and designing the world’s most advanced PLS model for the first on-line NIR application may not the best way to build advocacy with previous success. With diligence and a dedicated focus, NIR process instruments can aid manufacturers to realize their goals of reduced manufacturing costs, improved worker safety, and enhanced product quality.
Process Insights Model 412 NIR spectrometer
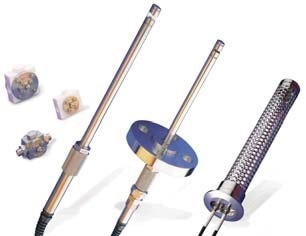
Process Insights assorted probes and flow cells
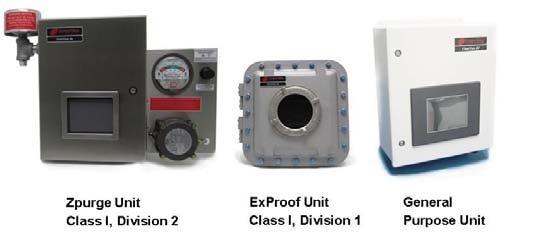
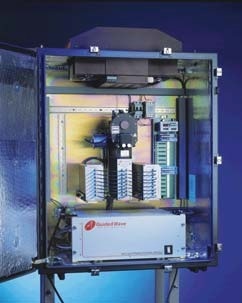
ClearView db Photometer enclosure options
References
- D. A. Burns and E. W. Ciurczak, Handbook of Near-Infrared Analysis, Marcel Dekker, New York, 1992.
- M. A. Scharaf, D. Illman and B. R. Kowalski, Chemometrics (Volume 82 in Chemical Analysis: A Series of Monographs on Analytical Chemistry and Its Applications), John Wiley & Sons, New York, 1986.
- H. Martens and T. Maes, Multivariate Calibration, John Wiley & Sons, New York, 1986.
- H. Mark, Principles and Practice of Spectroscopic Calibration, (Volume 118in Chemical Analysis: A Series of Monographs on Analytical Chemistry and Its Applications), John Wiley & Sons, New York, 1991.
- W. M. Doyle, “Principles and Applications of Fourier Transform Infrared (FTIR)Process Analysis” Process Control and Quality, (2) 11-41 (1992).
- K. J. Clevett, Process Analyzer Technology, John Wiley & Sons, New York, pp. 849-851 (1986).
- S. Jacobs and S. Mehta, “Process Quality Measurement Systems: An Integrated Approach to a Successful Program in Process Analytical Chemistry”, American Laboratory, 15-22 (December 1987).

This information has been sourced, reviewed and adapted from materials provided by Process Insights – Optical Absorption Spectroscopy.
For more information on this source, please visit Process Insights – Optical Absorption Spectroscopy.