In 1885, an English scientist, Lord Rayleigh, had hypothetically shown3 that waves could be propagated over the plane boundary between a vacuum (or an adequately rarefied medium, air for example), and a linearly elastic half-space, where the waves’ amplitude decays with depth exponentially.
Rayleigh predicted that these waves can be a notable component of earthquakes, a fact to be determined years later in the 1920s due to the introduction of seismographic recordings.
Such waves4 were produced by White and Voltmer from the University of California about 45 years later. Often, these waves are known as surface acoustic waves (SAW) or Rayleigh Waves, on the free surface of an isotropic and elastic substrate, like quartz.
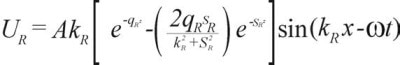
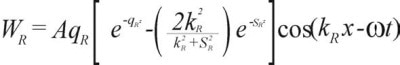
As can be observed in Figure 1, a pattern of displacements is generated by the action of the wave on the solid, and the dots in these displacements show material particles, and in the absence of wave motion they are nominally equidistant vertically and horizontally. Equations (1) and (2) supply the displacement components along the x and z axes, respectively.5
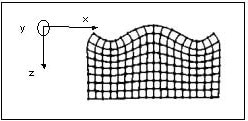
Figure 1. Surface acoustic waves. Image Credit: Sensor Technology Ltd
| (1) |
 |
| (2) |
 |
Where:
- A denotes an amplitude constant
- kR stands for the Rayleigh wave number
- kT = ω(ρ/μ)1/2 are the wave numbers for transverse modes
- kL = ω(ρ/(λ + μ))1/2 are the wave numbers for longitudinal modes
- μ and λ are the elastic Lame constants, ω is the circular frequency, and ρ is the material density
- sR = (kR − kT)1/2 and qR = (kR − kL)1/2
- x is the in-plane displacement, t is the time, and z is the vertical displacement
Since the components of displacement in the Rayleigh wave along the x and z axes, respectively (UR and WR), are moved in phase by π/2, the oscillation mode of particles supporting a Rayleigh wave is a retrograde ellipse, the normal (vertical) displacement of which reaches its highest test amplitude at a depth of about 0.2 λR (where λR refers to the Rayleigh wavelength).
Subsequently, within a couple of wavelengths from the surface, this decays to zero. Furthermore, it contains a displacement component in the plane of the solid surface.
Given that the material characteristics of the surface layer of a sample influence the velocity and attenuation of Rayleigh waves, the latter can be utilized to examine the remaining stresses in the surface layer, and also the thermal and mechanical characteristics of the sample’s surface layer.
For the non-intrusive surface testing of components, particularly strain measurement, the application of Rayleigh waves is based on this phenomenon. A transducer design that can measure such phenomena is needed.
Surface Acoustic Wave Transducer Construction
A surface acoustic wave has a crucial characteristic when compared to the phase velocity of a bulk wave in that direction, its phase velocity is slightly smaller.
Furthermore, the Rayleigh wave velocity is about 105 times slower when compared to the velocity of electromagnetic radiation in vacuo.
So, for the same frequency, the wavelength of the elastic wave is lower than the corresponding electromagnetic wave’s wavelength by a factor of 105.
This outcome has instant importance on the geometry of the ensuing gauge and shows the philosophy behind surface wave technology. The devices themselves may be relatively smaller than their electromagnetic equivalents, with the added advantage that the surface wave may be perceived immediately at any point along its path.
Notably, it can be shown3 that phase velocity dispersion is not demonstrated by the Rayleigh wave, so the velocity is not dependent on frequency. Metallic film transducers on the surface of a piezoelectric material generate the Rayleigh waves, as shown in Figure 2.
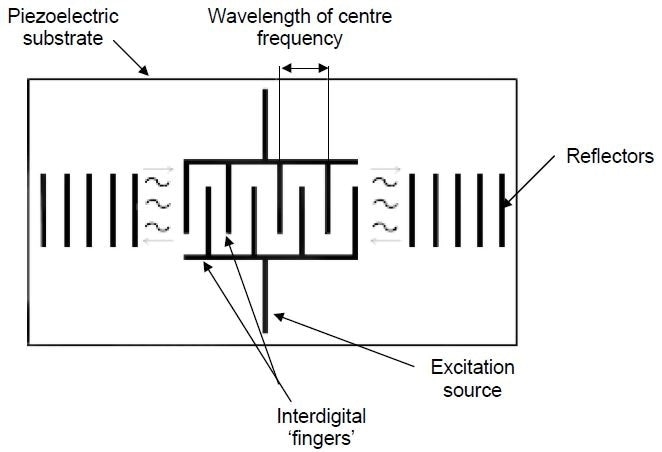
Figure 2. Outline of a basic SAW transducer. Image Credit: Sensor Technology Ltd
These metallic film transducers have an interdigital configuration, which can be developed immediately via classic integrated circuit technology. The period of the wave generated is regulated by the period of the fingers.
The surface of the piezoelectric material undulates intermittently when an alternating voltage is applied to the transducer, thereby creating waves. These waves create a one-port structure as they are reflected by an analogous array, the impedance of which can be set at a specified frequency, typically 50 Ω.
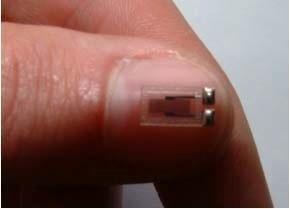
Figure 3. 200 MHz SAW resonator made of quartz shown against thumbnail. Image Credit: Sensor Technology Ltd
The operation of a SAW transducer for the measurement of strain is governed by choice of an appropriate piezoelectric substrate. This piezoelectric substrate can be connected to the material, which is to be stressed. A strain induced by the stress can be either in a state of tension or in a state of compression.
The sensitive axis of the transducer is longitudinal in the direction of wave propagation. The spacing of the inter-digital electrodes will be altered by strain change, and so, this is the reason for the operating frequency.
For example, for a 500 MHz excitation frequency, 1000 με of tension will decrease the frequency by 500 KHz (simply: 1000.e-6.500.e6); at the same time, a compressive strain will heighten the frequency by the same amount.
The transducer’s quality factor (Q) is high, typically 104. So, the impedance can be calculated to control a tracking oscillator; this can show the resonant frequency to within a few Hertz. From the technique discussed, it is clear that the output signal will be in the frequency domain shown in Figure 4.
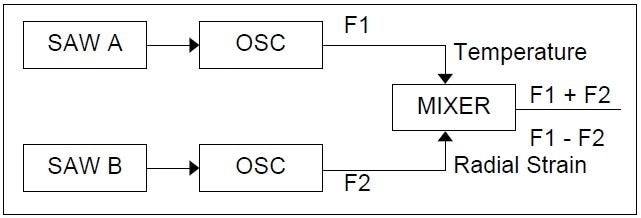
Figure 4. Schematic of frequency domain SAW signals. Image Credit: Sensor Technology Ltd
This has several advantages from an application standpoint, particularly in variable speed electrical machines where drive electronic generated noise can contaminate low-frequency signals easily. Designed at the 50 Ω standard, the SAW impedance means there is usually less noise than in its traditional resistance gauge equivalent (resistance is normally 100–350 Ω).
The highest power of the SAW signal is in the region of 25 mW, and so, when compared to a 10 V half-bridge resistive strain gauge system for instance, in which the overall power of the output strain signal is around 1 μW, the SAW supplies a more powerful solution for the measurement of strain.
Although piezoelectric transducers can be used for dynamic strain sensing, they have a high output impedance and provide poor temperature performance, both of which are major disadvantages.
Application of SAW Devices for Measuring Strain
Torque Measurement
One common device which is used by development engineers is torque (radial strain) transducers. A further understanding of rotational speed and torque can be employed to show power, from which electrical machines, transmissions, the efficiency of gearboxes, and several systems can be assessed quickly.
To use the SAW element principle, two devices – one positioned to monitor the principal tensile strain and the other positioned to be responsive to the principal compressive strain – are used in a half-bridge, as the configuration of standard resistive strain gauging.
It is worth noting that in the absence of bending moments and axial forces, the principal stress planes lie vertical to each other at 45 ° to the plane about which the tensional moment is induced. This can be observed in Figure 5.
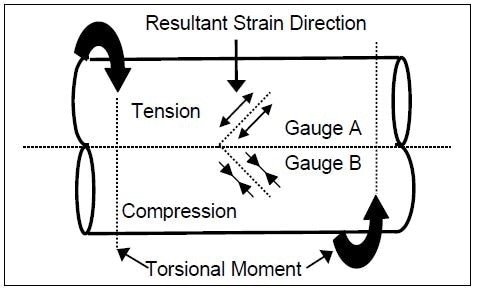
Figure 5. SAW gauge arrangement for torque measurement. Image Credit: Sensor Technology Ltd
The SAW generates two frequencies which are combined together to calculate the difference and/or sum signals. This difference signal is a measurement of induced strain due to the twisting moment, and so, the torque is implied based on the understanding of the governing equations and the material properties.
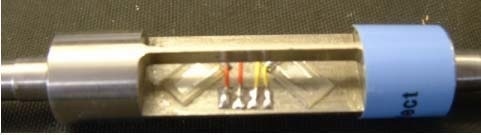
Figure 6. A typical structure — shaft with two SAWs attached. Image Credit: Sensor Technology Ltd
Yet, the sum signal is a measure of shaft temperature. An electromagnetic coupling device is utilized to understand the coupling of the signals to and from the machine shaft.
This electromagnetic coupling device consists of a pair of concentric loops which are detached by an appropriate distance; one concentric loop is fixed to the shaft housing, while the other is attached to the rotating shaft providing non-contact interrogation, which is intrinsically safe. This coupling is shown in Figure 7.
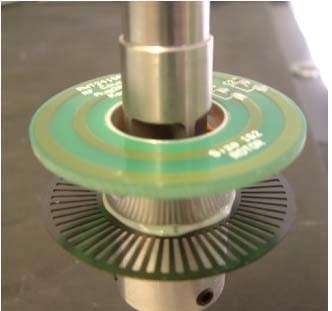
Figure 7. Electromagnetic coupling device mounted onto the shaft. Image Credit: Sensor Technology Ltd
The main frequency of oscillation can be chosen to lie between 100 and 1000 MHz with the difference frequency changing up to 1 MHz. A transducer such as this has the following specification:
- Resolution: 1 part in 106
- Bandwidth: >1 MHz
- Linearity: 0.1%
Conclusions
This article exhibits how SAW devices can be used as strain gauges functioning in the frequency domain. An enhanced sensitivity over previous devices by two orders of magnitude is not impractical. Furthermore, the low power needs, combined with low impedance, make these devices superior to traditional resistance gauges.
Due to their simplicity and ease of manufacture, it is likely that these devices will work well into the 21st century, just as the resistance gauge, which has served at the time of the 20th century.
References
- A Lonsdale & B Lonsdale EU Patent EP518900, USA Patent 5585571
- “Theory Of Elasticity,” Timoshenko, S. P., & Goodier, J. N., Third Ed., 1970, McGraw-Hill Inc.
- Lord Rayleigh (J. Strutt): “On waves propagated along the plane surface of an elastic solid,” Proc. Lon. Math. Soc., (17): 4-11, 1885.
- White, R.M. and Voltmer, F.W.: “Direct piezoelectric coupling to surface elastic waves,” Applied Physics. Letters, (7): pp 314-316, 1965.
- Viktorov, I.V.: “Rayleigh and Lamb Waves—Physical theory and applications,” Plenum Press, New York, 1967.

This information has been sourced, reviewed and adapted from materials provided by Sensor Technology Ltd.
For more information on this source, please visit Sensor Technology Ltd.