Texture Analyzers are very often used for quality control of irregular products by the use of empirical measurements.
The force required to crush a tablet or the distance a biscuit bends before it snaps are invaluable pieces of information to manufacturers looking to develop new products or ensuring products perform correctly during spot checks. This type of test is ideal for products that have an unusual geometry, but it is also useful for testing more complicated systems, such as the combination of a product and its packaging (a box of eggs, the force to open a ring pull can or a yoghurt in its pot) with the added benefit of time saved by allowing a product to be tested straight off the supply line.
However, a large number of users use the suite of Texture Analyzers to calculate more fundamental parameters by taking into account the geometry and dimensions of the sample as well as the specifics of the test set up along with the relevant engineering equations. This type of testing allows easier comparison of different samples and comparison with literature data, but does require more sophisticated analysis to convert forces to stress and distances to strain.
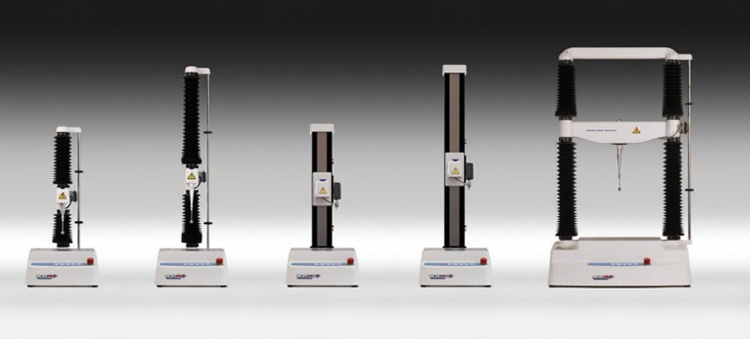
Materials parameters can be performed on a range of instruments of differing load capacity. Image Credit: Stable Micro Systems
Typical Fundamental Tests that can be performed on a Texture Analyzser
Indentation Testing
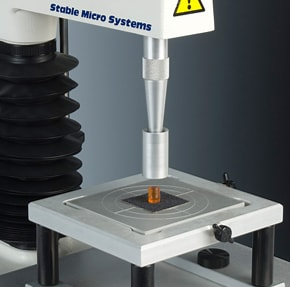
Indentation testing, for instance, is often used to measure the force required to penetrate a probe into a sample’s surface a set distance. Instrumented (computer controlled) indentation testing has now been in use for many years, and involves the collection of force, displacement and time data, which is why the Texture Analyzer is so well-suited to this type of measurement.
It is a very useful test for monitoring the quality of irregular objects (such as the firmness of apples at different temperatures) by simply indenting to a set distance and looking at the force peak. However, this test setup can also provide some more fundamental parameters if the sample has a flat surface and a homogeneous structure, providing accurate measurements are made during the test. During an indentation, the loading arm moves down at a constant speed, pushing the probe into the sample until it reaches a set force or distance. This force (or distance) is held for a given time period and the probe withdraws from the sample surface at a second constant speed. A residual imprint of the indenter is left behind in the sample, which corresponds to the amount of plastic deformation that took place. The majority of elastic deformation is released as the probe withdraws from the sample.
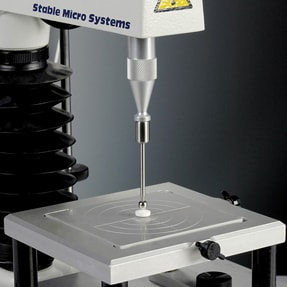
Indentation test (Brinell tablet hardness) using spherical probe. Image Credit: Stable Micro Systems
Instrumented indentation is a quick and simple technique, and once the analysis procedure has been established by use of an Exponent macro, several useful parameters are calculated at the press of a button with no additional input from the user. Stable Micro Systems currently provide conical probes of various internal angles, spherical probes of various radii (for Brinell testing) and Vickers probes. Once the area function is known, several parameters can be calculated, including hardness, indentation modulus and plastic and elastic indentation energies.
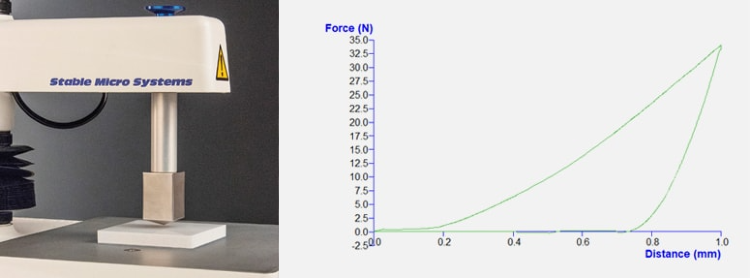
Vickers Hardness probe and typical curve obtained. Image Credit: Stable Micro Systems
After indentation testing, tension, compression and bending tests are some of the simplest to perform on a Texture Analyzer.
Tensile Testing
Tensile testing involves a sample held in two grips a set distance apart. The loading arm (attached to the top grip) moves up at a constant speed to deform the sample, first deforming it elastically then plastically. If the force required to break the sample is within the limit of the load cell, fracture will occur. This test setup can also provide useful stress-strain data if the sample has a uniform cross-section, providing accurate measurements are made of the sample’s dimensions. “Dogbone” shaped specimens are often used in tension, with two wide sections tapering to a narrower central section. This central section has a uniform cross-section. These specimens are designed to encourage deformation away from the grips and into the central section in a controlled manner. Dogbone specimens are not mandatory, however. As long as the sample has a uniform cross-section, is long enough to grip properly and does not break off at the grips, it will be suitable for tensile testing.
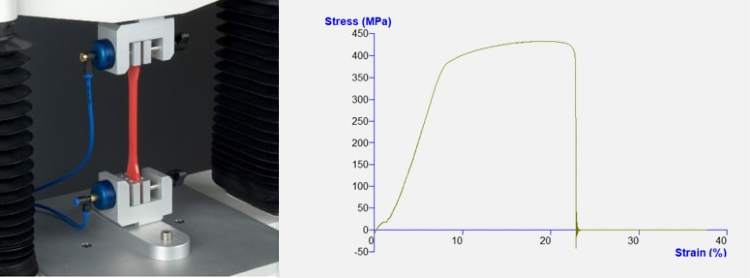
Pneumatic tensile grips holding a plastic dogbone specimen and resulting stress-strain graph. Image Credit: Stable Micro Systems
As with all tests, the force applied, the distance moved by the probe and the time are all recorded in Exponent software. The force-distance graph usually begins with a straight section that corresponds to elastic (reversible) deformation, then most samples show a curved section that shows plastic (irreversible) deformation. Different samples will give different load-distance responses – stronger and stiffer samples show higher forces, brittle samples break before any plastic deformation occurs and tough samples show a large area under the curve corresponding to a large amount of energy required for deformation.
Different materials show very varied graph shapes. Several useful parameters can be calculated from a tensile stress-strain graph, using the standard engineering equations for stress and strain of a beam undergoing tension. Round and flat tensile dog-bones are common in tensile testing but samples with a cross-section of an irregular shape may be used if their cross-sectional area can be calculated. Once the y-axis has been set to show stress and the x axis strain, the resultant stress-strain curve can be used for the fundamental analysis. The most frequently calculated parameters from a tensile test are yield stress, yield strain, resilience, 0.2% proof stress, Young’s modulus, ultimate tensile strength, breaking strain, energy to failure, necking onset, hysteresis, strength coefficient, strain hardening and strain rate.
For materials that follow nonlinear elastic stress-strain behaviour, the values of tangent, secant or chord moduli are useful in estimating the change in strain for a specified stress range.
Compression Testing
Depending on the sample type, compression is often used in preference to tensile testing. Compression testing involves a self-supporting sample being compressed under a flat probe large enough to cover the whole sample. The loading arm (attached to the probe) moves down at a constant speed to deform the sample, first deforming it elastically then plastically (if it is not completely brittle). If the force required to break the sample is within the limit of the load cell, fracture may occur. However, this is not always the case in compression as many samples are stronger (or tougher) in compression than in tension, especially ceramic samples, and very plastic samples tend to flatten with increasing stress.
Probe used for compression of a cylindrical gel sample. Image Credit: Stable Micro Systems
Most of the tensile parameters can also be measured from a compression graph. However, these parameters may all have values different from those expected from the same sample tested under tension (although Young’s modulus is generally the same for either test type). Stress values at a given strain under compression are usually higher than they would be in tension.
Additionally, if a compression test is set up in such a way as to constrain the sample on all sides, the bulk modulus can be measured.The bulk modulus is a defined as the relative change in a sample’s volume when a unit compressive or tensile stress acts uniformly over its surface. It is a measure of how resistant a substance is to pure compression. Its measurement is possible by the use of a Texture Analyzer, providing care is taken over the sample setup. A cylinder probe and cylindrical container with very similar diameters must be used for performing a bulk modulus test, as the whole sample must be in compression. If the probe is much smaller than the container, it becomes a penetration test.
Bend testing
When a consumer is presented with an elongated or flat food sample, one of the first things they might do is snap it between their hands. During this process, they are subconsciously assessing whether the food product is brittle or ductile, stiff or compliant, and strong or weak. Consequently, bend testing is a technique used very frequently by Texture Analyzer users, covering everything from the snap of tablets to the toughness of dog chews. The analysis of this type of testing is often in its most simple form of looking at a force peak and maybe the distance to fracture. It is a very useful test for monitoring quality of irregular objects. However, this test setup can also provide useful stress-strain data if the sample has a uniform cross-section, providing accurate measurements are made of the sample dimensions. “Flexure” and “bending” have the same meaning and are often used interchangeably.
Three point bend testing is the most commonly used set up and involves a long sample being placed on two supports (or “rollers” – named due to their curved surface) a set distance apart, with a third roller moving down to contact the sample halfway between these supports. The loading arm moves down at a constant speed to bend the sample, first deforming it elastically then plastically. If the sample is sufficiently brittle and the force required within the limit of the load cell, fracture will occur.
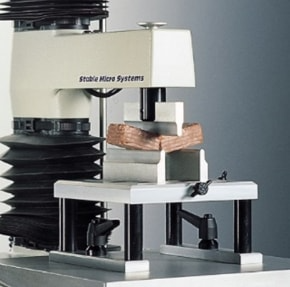
Three point bend test of a cuboid wafer sample. Image Credit: Stable Micro Systems
Different samples will give different load-distance responses in bending – stronger and stiffer samples show higher forces, brittle samples break before any plastic deformation occurs and tough samples show a large area under the curve corresponding to a large amount of energy required for deformation. The points on the sample that have the highest stress applied are the top and bottom surfaces at the loading point, and this is where the sample is most likely to fail.
Due to the often elongated nature of bend test samples, bend testing is frequently used along with, or instead of, tensile testing, as both tests suit similar samples. However, bend testing has some advantages over tensile testing.
The main measurement that can be taken from a three-point bend test is the flexural stress-strain response. From this, the flexural modulus, yield stress, ultimate flexure stress and toughness can be calculated. As long as the cross-section is uniform, any shape may be tested in this way. The “flexural stress” and “flexural strain” are the values for stress and strain at the outermost fibres – top and bottom surfaces – and they depend on the force applied by the Texture Analyzer and the distance the probe has moved as well as the sample geometry. Their calculation depends strongly on the sample width and height as well as the gap between the supports. The support gap is very easy to control as it can be measured accurately once then set to remain the same for each test. The sample dimensions are best measured using digital calipers, taking three measurements along the length of the sample and calculating the average. The larger the sample, the smaller the possibility of error.
Stable Micro Systems has incorporated a large number of test procedures and analysis methods suitable to obtain fundamental materials parameters that could be used across a wide range of industries. Whilst the equipment can provide a simple and flexible empirical solution it is also able to offer the traditional measurements well established within the materials industry.
There is a summary of typical texture analysis tests that can be performed on materials or watch this to see the highlights: Materials video on Youtube:
Materials & Packaging Physical Characterisation