Pulsed Field Gradients have proven very useful for enhancing the capabilities of NMR spectrometers and enable a number of useful modern pulse sequences.
Benefits of Pulse Field Gradients
- The ability to separate the spectra of different components in a mixture by molecular mobility e.g. Diffusion-Ordered Spectroscopy (DOSY) experiments
- Measuring self-diffusion coefficients to understand molecular mobility e.g. PFG / PGSE self-diffusion measurements
- Accelerating the acquisition of modern 2D NMR experiments e.g. Ultra-fast 2D NMR
Diffusion-Ordered Spectroscopy (DOSY)
By taking advantage of the different molecular self-diffusion coefficients of compents in a mixture the NMR spectra can be separated using the DOSY experiment. In the example below, the spectrum of a mixture of procaine and paracetamol in D2O is shown in the middle scan in Figure 1 with the spectra of the pure compounds above and below it.
Because several peaks overlap there is often a challenge to work out the different compontents and their respective concentrations in a mixture. The DOSY experiment allows us to separate the spectra of the two components.
These spectra are all acquired on a Spinsolve benchtop NMR spectrometer with additional hardware that enabled Pulsed Field Gradients.
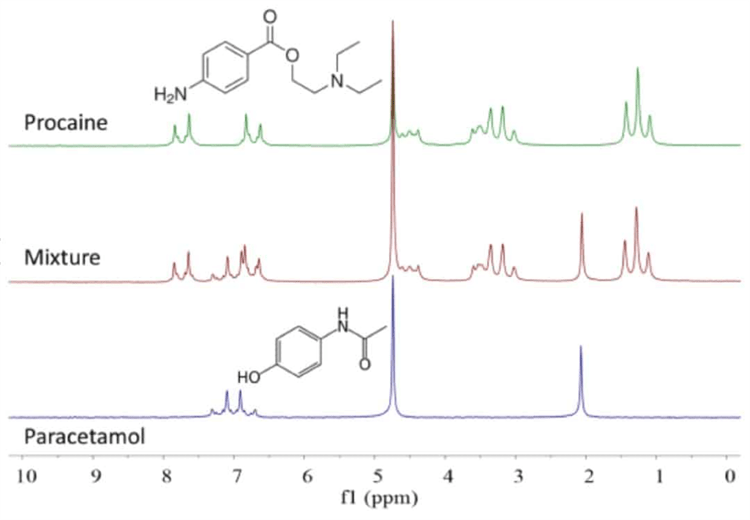
Figure 1. 1H NMR spectra of paracetamol (bottom), procaine (top) and a 1:1 mixture in D2O. Concentration 200 mM, 1 scan.
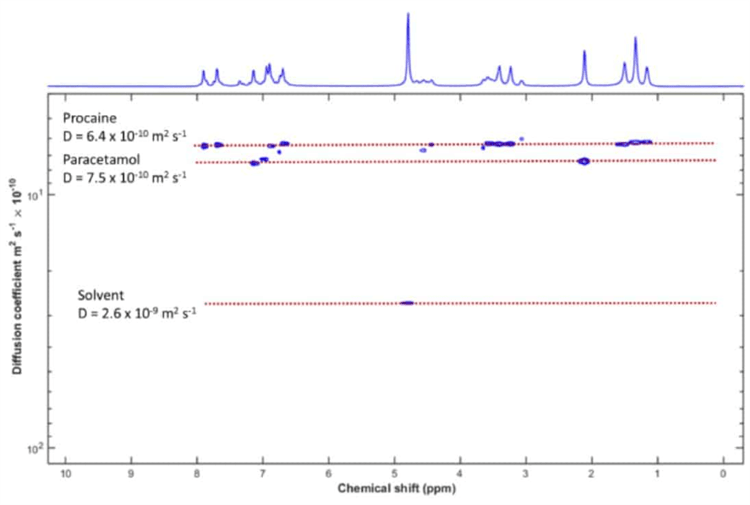
Figure 2. DOSY analysis of the mixture. The two solutes plus the solvent can be clearly resolved.
Diffusion ordered spectroscopy creates a two-dimensional plot by acquiring a set of spectra as a function of the amplitude of the gradient. The horizontal axis shows the measurements of the chemical shift, and the vertical axis shows the self-diffusion coefficient.
The DOSY Toolbox is used to analyse the data and create the 2D DOSY spectrum shown in Figure 2.
It is clear to see that the peaks of the different components are aligned along horizontal lines. All of these lines correspond to a different self-diffusion coefficient. As a result, they also correspond to a different component of the mixture.
We can separate the solvent peak and the other two components, despite the fact that their diffusion coefficients vary by only 10%. This result shows how DOSY can be a powerful tool for mixture analysis in NMR spectroscopy when there is a range of diffusion coefficients among the components used.
Measuring Self-Diffusion Coefficients
The following experiment included three different componets where three different nuclei can be used to determine diffusion constants of each component. Making use of the full power of the Spinsolve NMR Spetrometer, we demonstrate how the diffusion coefficient of different nuclei can be measured in the same instrument, and ascertain the molecular mobility of each species present in the sample.
For these experiments, mixtures of 1-butyl-3-methylimidazolium tetrafluoroborate (BMIM-BF4) and lithium tetrafluoroborate (LiBF4) at different lithium concentrations were used. Measurements of the diffusion coefficients were conducted with a PGSTE sequence for each nucleus.
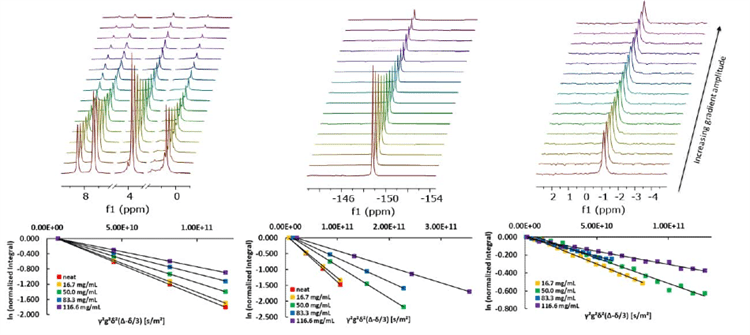
Figure 3. a) PGSTE experiments of 50 mg/mL LiBF4 in BMIM-BF4. From left to right: 1H, 19F, and 7Li spectrum. b) Stejskal-Tanner plots of the respective 1H, 19F, and 7Li data.
The high quality of the NMR data can be seen in the linear behavior of each diffusion plot. Linear fitting of these data points provides the self-diffusion coefficients for the three different nuclei and can be done directly in the software. As a result, the diffusion of the three different components in the different samples can be determined.
User-Friendly Interface
Additional benefits of the Spinsolve software include:
- A simple user interface implemented in the standard Spinsolve® software
- Direct access to parameters related to active diffusion experiments, from maximum gradient strength and number of steps to δ and ∆)
- Plotted integrals and fully automated diffusion analysis carried out by the Spinsolve® software.
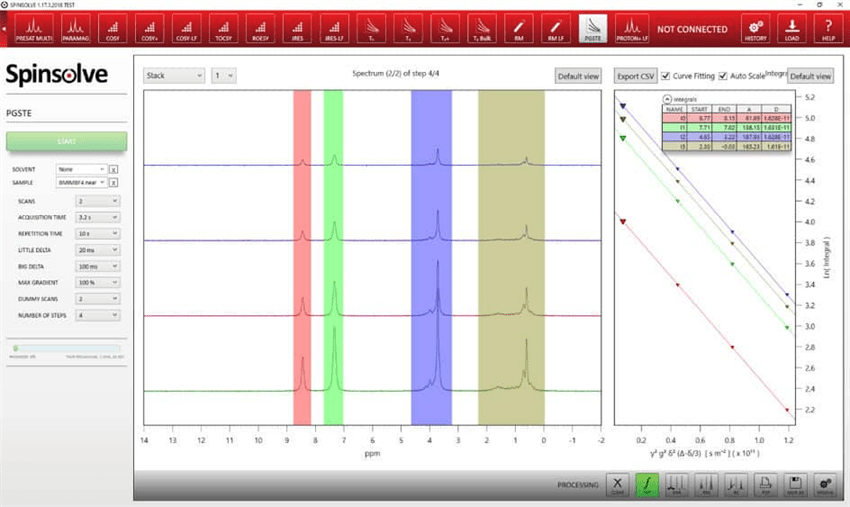
Figure 4. a) PGSTE experiments of 50 mg/mL LiBF4 in BMIM-BF4. From left to right: 1H, 19F, and 7Li spectrum. b) Stejskal-Tanner plots of the respective 1H, 19F, and 7Li data.