For many years, the structure of natural shell samples has attracted a great deal of interest from Material Scientists as well as Researchers in the Biological Sciences field [1]. The reason for this interest is shells have physical properties that far exceed than those of their constituent minerals: the mother of pearl structure or “nacre”, in particular, contains tiny, interlocking aragonite tablets (orthorhombic CaCO3) that are separated by organic matrix membranes, as shown in Figure 1.
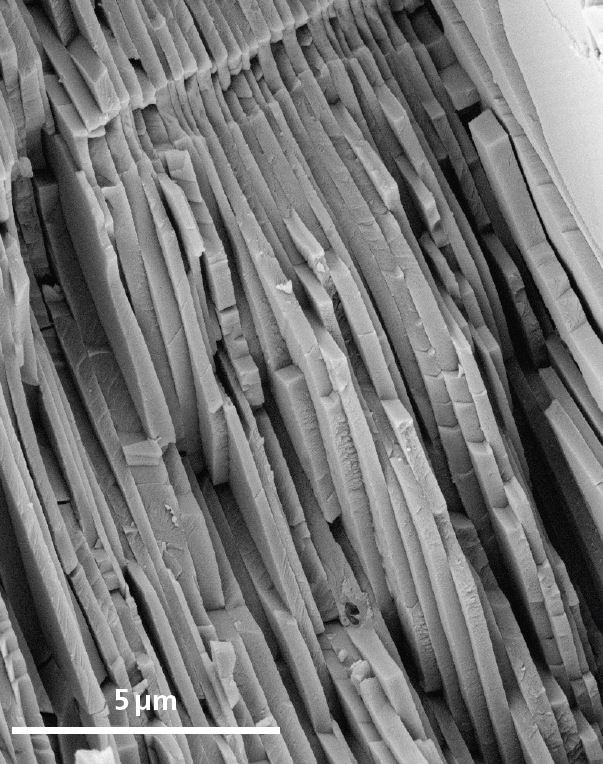
Figure 1. Secondary electron image of aragonite nacre. Image Credit: Oxford Instruments
When compared to single aragonite crystals, nacre possesses excellent strength. This structure is being mimicked by Researchers to create similar types of high-strength materials. The aragonite tablets have a thickness that is similar to the wavelength of visible light (for example ~ 500 nm) which results in the characteristic iridescence of nacre, but presents considerable challenges for effective characterization of microstructures.
Over the past 10 years, EBSD has turned out to be a routine method for inspecting biomineralized structures such as mollusk shells (e.g. snails and oysters), egg shells and even fossilized structures [2, 3]. However, the majority of these applications involve the study of relatively coarse grained calcite (trigonal CaCO3) structures that are easy to analyze. By contrast, aragonite nacre is very fine grained and is also sensitive to beam, and hence only few published studies are available that demonstrate the effective EBSD characterization of nacre layers. One such analysis [4] showed that there is a need for low beam energies to effectively analyze nacre, revealing orientation maps with 100 nm measurement step sizes obtained at 8 kV accelerating voltage. While the spatial resolution of the EBSD technique is considerably enhanced by the low beam energy, it was usually at the expense of signal. Even in the case of sensitive CCD-based EBSD detectors, the collection of diffraction patterns require long exposure times. The key to successful measurement of nacre structures is low beam energies as well as a low electron dose at each point.
This can be accomplished by either reducing the exposure time for collection of each EBSD pattern or by reducing the electron beam current (for instance, through the use of smaller spot sizes or apertures). In either case, it is essential to have a sensitive EBSD detector.
This article shows how the groundbreaking Symmetry® detector based on custom-developed CMOS technology integrates high sensitivity with excellent speed, making it the detector of choice for analyzing challenging, beam-sensitive and fine grained structures such as aragonite nacre. The article also shows results obtained from regular analyses of the interfaces between calcite and aragonite in the shell of the mollusk Mytilus edulis, generally called the common mussel.
Experimental Details
Parts of the mussel shell were first mounted in epoxy, then ground and polished for EBSD analysis, and finally finished with 5 minutes of colloidal silica polishing. Approximately ~ 5 nm of carbon was used to coat the sample and then using conductive Ag paint, the sample was grounded to an appropriate SEM stub. The shell’s cross-sections were then studied in a field emission gun SEM working at 12 kV accelerating voltage and with a beam current of approximately ~ 7.5 nA, at a working distance of 15 mm. Next, EBSD patterns were collected using the Symmetry EBSD detector at a resolution of 312 x 256 pixels. Two maps were eventually collected - the first map was collected using a 80 nm step size on a grid of 1508 x 680 measurements, with a camera exposure of 3 ms (indexing at 330 patterns per second), and the second one was collected with a step size of 60 nm on a grid of 1093 x 1413 with a camera exposure of 2.5 ms (indexing at 395 patterns per second). The indexing hit rates were 97.7 % and 96.7 % respectively, and minor processing was carried out to remove incorrectly-indexed and non-indexed pixels.
Results
Area 1
Figure 2 summarizes the results from area 1. The phase map, shown in Figure 2a, reveals the irregular nature of the boundary between aragonite and calcite at this location. Figure 2b shows the orientation map, demonstrating that the calcite has an extremely strong texture, while the aragonite has domains up to 5 µm across various nacre layers. Further, the aragonite boundary misorientation distribution demonstrates clear peaks at about 53 ° and 64 ° misorientation: these are related to aragonite triplet twinning, with crystallographic rotations about the <001> direction.
In Figure 2b, the twin boundaries are indicated in yellow and red and account for 11.3 % and 37.7 % of high angle boundaries in the aragonite, respectively.
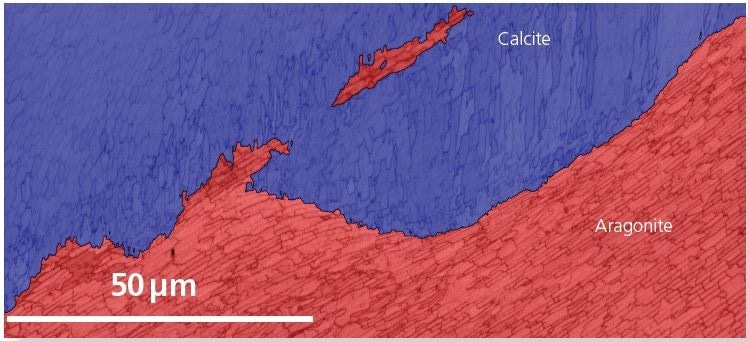
Figure 2a. Area 1 phase map: calcite - blue, aragonite - red. Image Credit: Oxford Instruments
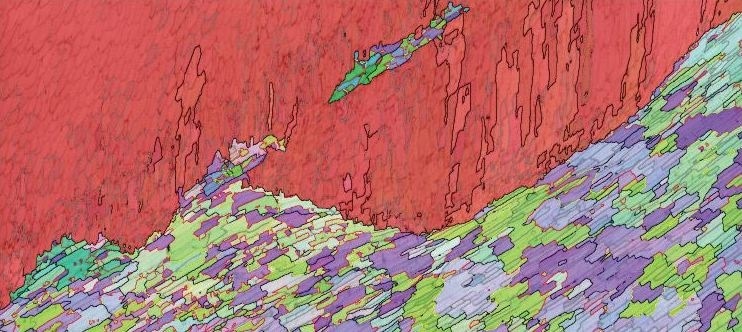
Figure 2b. IPF orientation map, showing high angle boundaries in black and low angle boundaries in grey. In aragonite, special boundaries are marked in red (63.8 ° <001>) and yellow (52.4 ° <001>). Image Credit: Oxford Instruments
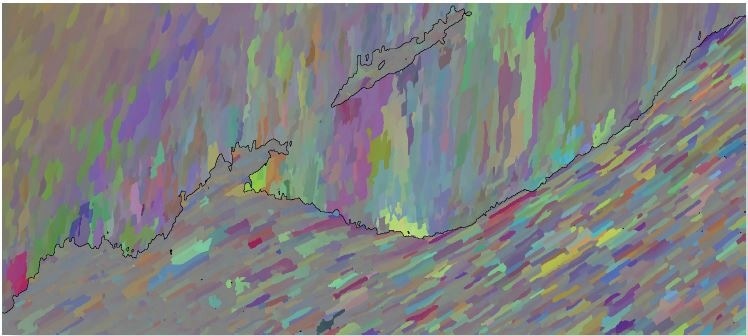
Figure 2c. Disorientation colored map, highlighting small orientation colors in both phases. Image Credit: Oxford Instruments
The Disorientation coloring scheme (Figure 2c) is used to highlight the slight changes in orientation in both phases. This clearly shows the tablet structure in the nacre (the “hypostracum”) and also the scalloped sub-grains inside the calcite (the “prismatic calcite” or “ostracum” layer).
Figure 3 more clearly shows the nanoscale microstructural information available within this dataset, indicating a small part of the large dataset at the calcite-aragonite interface. The data here has had incorrectly isolated indexed pixels removed but has otherwise had no subsequent filtering. The detail within and across sub-500 nm wide nacre layers is apparent, as are intricate structures at the interface itself.
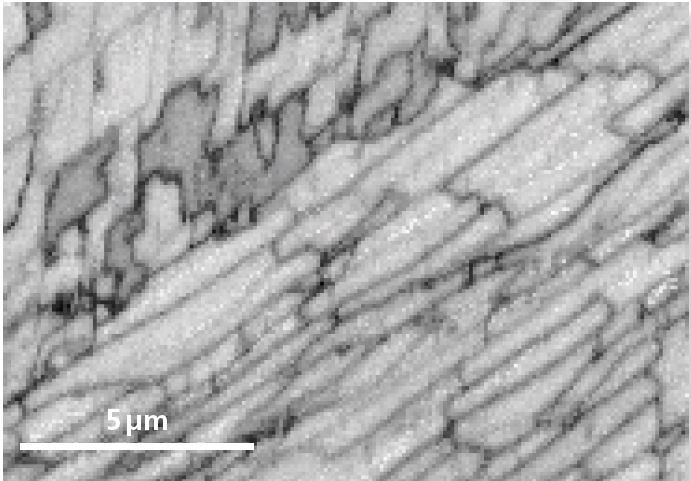
Figure 3a. Pattern quality map from a small section of Area 1. Image Credit: Oxford Instruments
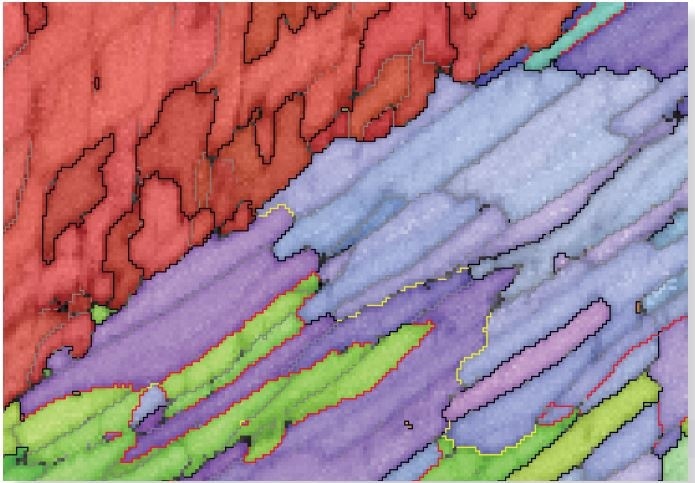
Figure 3b. IPF orientation map, showing high angle boundaries in black and low angle boundaries in grey. In aragonite, special boundaries are marked in red (63.8 ° <001>) and yellow (52.4 ° <001>). Image Credit: Oxford Instruments
Area 2
The nacre layers in Area 2 were generally narrower (usually 300 – 600 nm), requiring a smaller measurement step size of 60 nm. Figure 4 shows the results, which once again demonstrate the intricate detail within both phases: except for a broad aragonite layer proximal to the interface between calcite and aragonite, the width of the nacre layers reduces as this interface is approached.
Figure 4a shows the pattern quality map, demonstrating sample stability during the analysis and fine resolution of even the most intricate structures. As shown in Figure 4b, the orientation map highlights the abundance of twin boundaries present in the aragonite nacre, as well as a dominant orientation in the calcite.
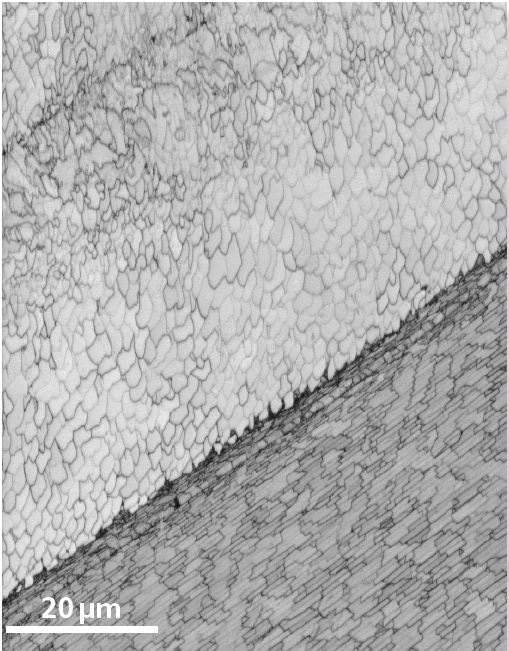
Figure 4a. Pattern quality map from Area 2. Image Credit: Oxford Instruments
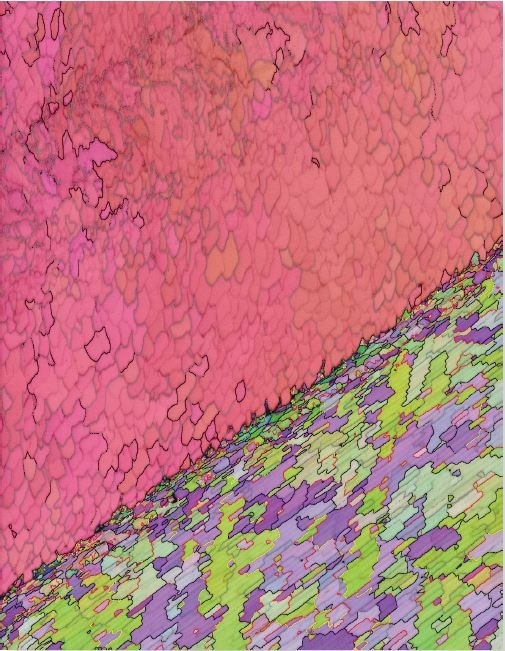
Figure 4b. IPF orientation map, showing high angle boundaries in black and low angle boundaries in grey. In aragonite, special boundaries are marked in red (63.8 ° <001>) and yellow (52.4° <001>). Image Credit: Oxford Instruments
The orientations of the two phases are illustrated in the pole figures (Figure 5). Also, Figure 5 clearly shows the near-single crystal nature of the calcite, as well as the extremely strong alignment of {001} in the aragonite – a well-documented texture in nacreous layers.
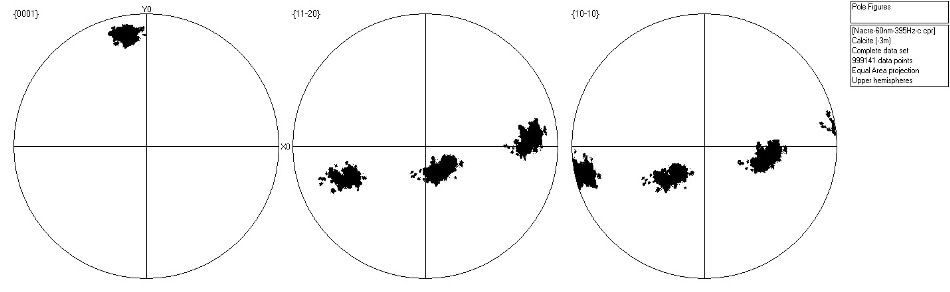
Figure 5a. Scattered pole figure showing poles to {0001}, {11-20} and {10-10} in the calcite in Area 2. Image Credit: Oxford Instruments
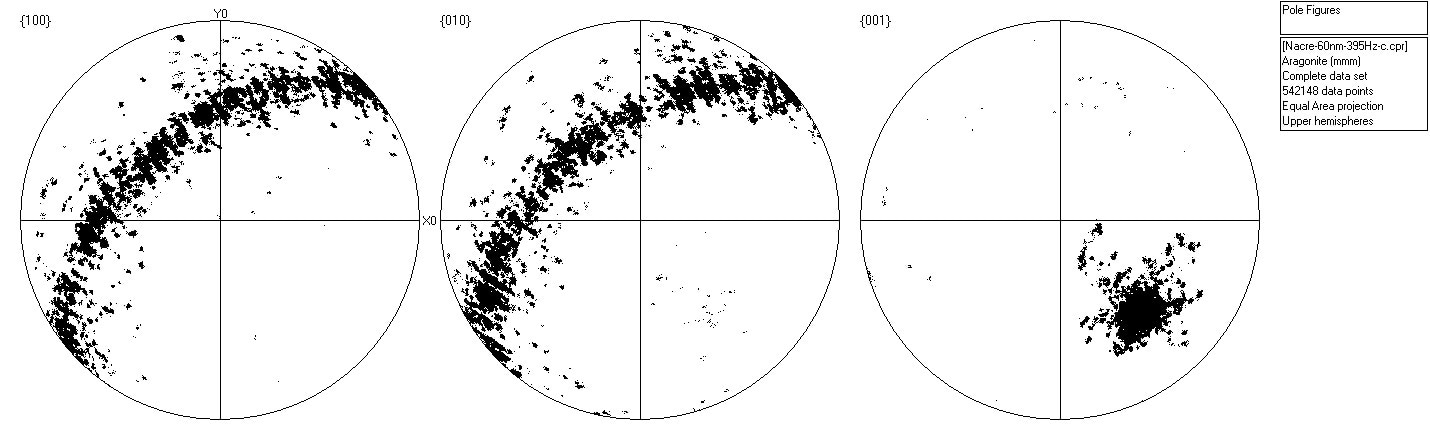
Figure 5b. Scattered pole figure showing poles to {100}, {010} and {001} in the aragonite in Area 2. Image Credit: Oxford Instruments
Conclusion
Owing to the beam-sensitive nature of the carbonate minerals and the sub-µm scale of layers in nacre, EBSD-based analysis of shell structure is particularly difficult. Only few successful studies of aragonite nacre exist in the published literature, and those that are available almost definitely needed comprehensive post-analysis data filtering to expose the complex structures of the nacre layers.
This article has demonstrated how the combination of extreme sensitivity and high speed of the advanced Symmetry CMOS-based EBSD detector provides a technological breakthrough for studying biomineralized samples. Two examples were described here, where large areas across the calcite-aragonite interface in a common mussel (Mytilus edulis) were studied with sub-100 nm resolution. Excellent diffraction patterns could be collected and indexed in less than 3 ms, enabling damage-free analyses with exceptional indexing hit rates. The resulting phase and orientation maps highlight the intricate structures within these shells and provide a better understanding about twinning, microtexture and detailed structure in these extraordinary materials.
References and Further Reading
- Mayer, G. (2005). Science, 310, 44-47
- Schmahl W.W. et al. (2009). Particle & particle Systems Characterization, 25, 474-478
- Perez-Huerta, A. et al. (2008), Mineralogical Magazine, 72, 563-568
- Griesshaber, E. et al. (2013). Acta Biomaterialia, 9, 9492-9502

This information has been sourced, reviewed and adapted from materials provided by Oxford Instruments.
For more information on this source, please visit Oxford Instruments.