Traditional CCD-based EBSD detectors can analyze metals and alloys with speeds higher than 1000 indexed patterns per second (pps), however their ability to acquire data from geological samples has often been limited to significantly slower speeds, normally below 100 pps, due to the weaker signal and lower symmetries of mineral phases.
The introduction of the Symmetry CMOS-based EBSD detector, along with the powerful AZtec® software, has significantly improved acquisition speeds. Although data collection from metal samples can now be routinely performed at speeds higher than 3000 pps using Symmetry, the fact that extreme pixel-binning of the diffraction patterns is not required for high acquisition speeds means that similarly impressive results are also achievable on rock samples without compromising data quality.
This article discusses the characterization of the microstructure in a fine-grained, deformed quartz rock using Symmetry at speeds approaching 1000 pps.
Experimental Method and Results
A polished thin section was prepared from a mylonitic quartz vein from Lewisian rocks in NW Scotland. The vein has been severely deformed, with significant dynamic recrystallization causing grain size refinement down to 10-20 µm. Before analysis, colloidal silica was used to mechanically polish the sample down to a final stage, followed by coating the resulting sample with ~ 5 nm carbon.
Two areas of the sample were investigated on a field emission gun SEM, with EBSD data acquired using the Symmetry detector and the Aztec software, acquiring patterns with a pixel resolution of 312 x 256. The first single area analysis covered an area of ~ 1.2 x 0.9 mm, using a measurement step size of 0.75 µm. The total of ~1.9 million analysis points was completed in 32 minutes at almost 1000pps, with a 96% indexing success rate. Numerous pores in the sample (vsible as black regions in the orientation map shown in Figure 1a) contributed to the non-indexed fraction.
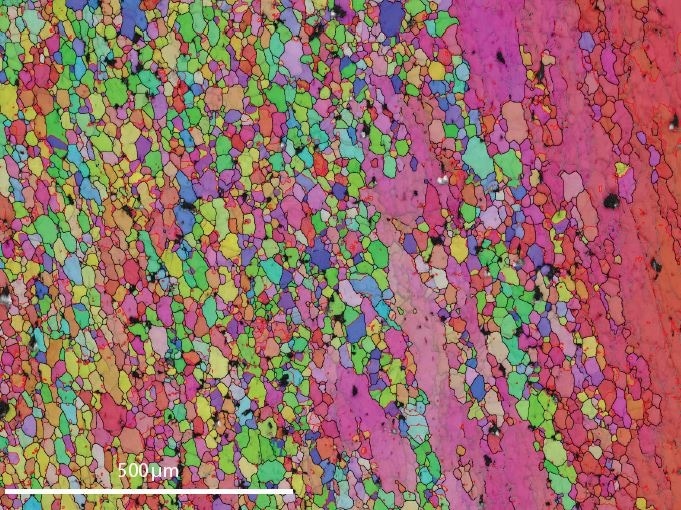
Figure 1a. Orientation map of the first area (inverse pole figure coloring scheme). Grain boundaries are marked in black, low angle boundaries in grey and Dauphiné twin boundaries in red. Black spots are voids in the sample. Image Credit: Oxford Instruments
From the orientation map shown in Figure 1a, the dynamically recrystallized grains and a few large relict grains can be observed to the left and the right of the area, respectively. The relict grains consist of low angle boundaries in significant numbers and the overall area reveals an abundance of Dauphiné twins (effectively 60° rotations about the c-axis).
Figure 1b shows the grain size distribution. The mean grain size for the whole area is 18.54 ± 0.32 µm, excluding the twin boundaries. Even in this relatively small area, the crystallographic preferred orientation as visualized in a c-axis pole figure (Fig. 1c) shows the development of a crossed girdle structure, common in this type of deformed quartz-rich rock.
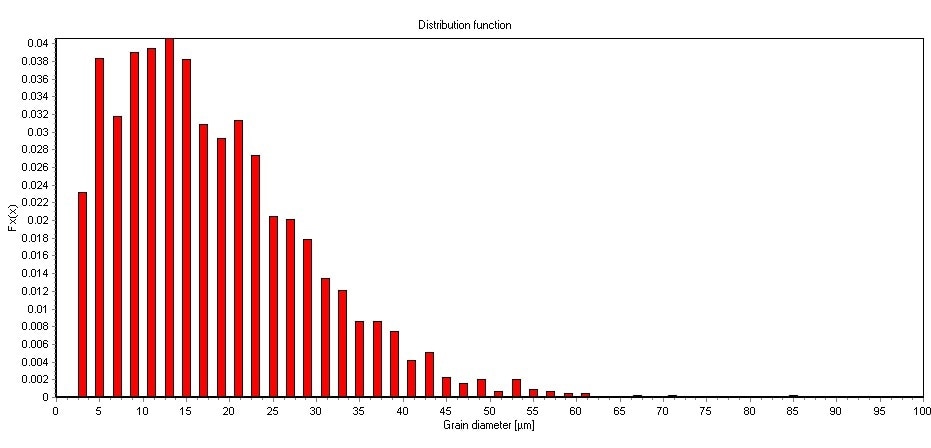
Figure 1b. Grain size distribution histogram for the first measured area. N=2267, mean=18.54 ± 0.32 µm. Image Credit: Oxford Instruments
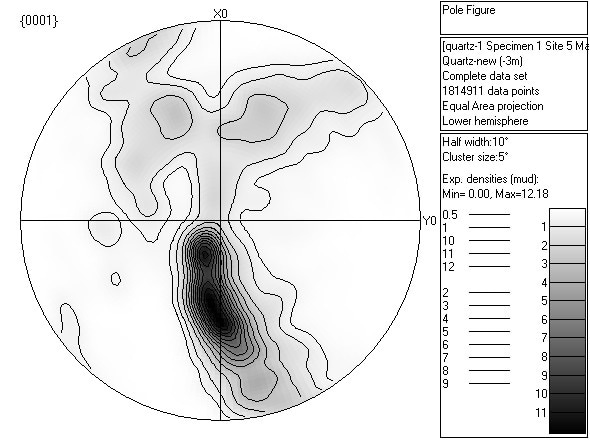
Figure 1c. Contoured {0001} pole figure showing development of a c-axis crossed girdle. Image Credit: Oxford Instruments
Large Area Mapping was used to analyze the second, larger area, covering a total area of 9 x 1.5 mm with a measurement step size of 1.5 µm. As with the first analysis, the acquisition speed was just below 1000 pps and the hit rate was above 96%. A total of 6.2 million points were collected in 105 minutes. This area covered a higher strain area of the sample, and the orientation map (Fig. 2a) shows that few relict grains remain, with almost complete recrystallization. Different colored bands correspond to areas with different crystallographic preferred orientation; however, the pole figure for the whole area (Figure 2b) shows the full development of a c-axis crossed girdle.
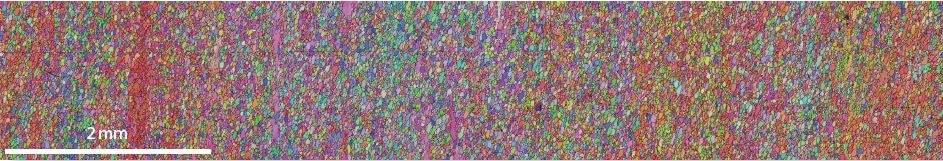
Figure 2a. Orientation map of the second area (inverse pole figure coloring scheme). Grain boundaries are marked in black, low angle boundaries in grey and Dauphiné twin boundaries in red. Image Credit: Oxford Instruments
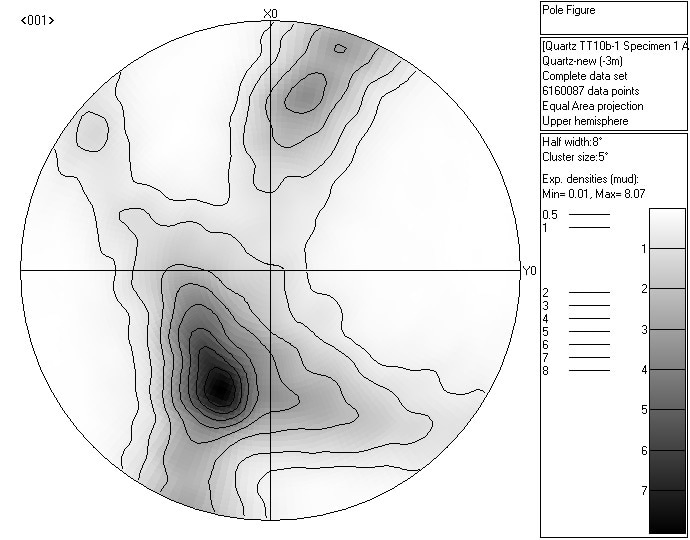
Figure 2b. Contoured {0001} pole figure showing full development of a c-axis crossed girdle. Image Credit: Oxford Instruments
Conclusion
The example discussed in this article has demonstrated how simple geological samples can be rapidly and effectively characterized using the combination of the Symmetry EBSD detector and the AZtec EBSD software. Unlike traditional CCD-based detectors, Symmetry permits high acquisition speeds without the need for excessive pixel binning, ensuring that good, high resolution patterns are collected at every point. As a result, uncompromised data is of high quality, making rapid characterization of the microstructures of rock samples a simple and routine process. What took several hours or even days with traditional CCD-based detectors can now be completed within minutes, expanding the appeal of EBSD as a routine characterization tool.

This information has been sourced, reviewed and adapted from materials provided by Oxford Instruments.
For more information on this source, please visit Oxford Instruments.