The pharmaceutical industry experiences a number of challenges in drug development, quality control and manufacturing, taking into account the consequences of an ineffective or inappropriate drug being consumed by a patient. One main concern is that many active pharmaceutical ingredients (APIs) show polymorphism, where different forms or molecular structures of a compound can intensely affect the stability, efficacy and bio-availability of the drug, with potentially shocking effects on patient outcomes.
These structural changes are in many cases hard to detect and quite subtle, and may unintentionally take place during different stages of formulation, packaging, storage and handling. Consequently, reliable and rapid identification of polymorphs during the development, manufacturing and quality assurance process is vital for all pharmaceutical manufacturing companies.
It is possible to observe such structural shifts of a compound through several ways. Raman spectroscopy is used for observing small band shifts in the “fingerprint” region (200-1800 cm-1), however these reflect subtle shifts in functional groups and are frequently difficult to detect for many polymorphs. X-ray diffraction (XRD) techniques produce extremely quantitative and conclusive analysis, but need expensive equipment and destructive off-line testing.
Terahertz (THz) spectroscopy can effortlessly differentiate structural shifts, as these signals correspond to large scale motions in the inter-molecular and molecular structure; however, THz spectroscopy has a restricted spectroscopic range, is comparatively expensive, is susceptible to the presence of moisture and can attain special sample preparation or temperature changes in order to boost the signal.
Recently, a new Raman-based solution has been commercialized that integrates a new capability to observe molecular structure, while simultaneously performing the comprehensive, non-destructive chemical compositional analysis already linked with standard Raman spectroscopy. These new spectroscopy systems extend the range of traditional Raman spectroscopy down into the low frequency (low wavenumber) spectral regime and beyond into the anti-Stokes region, where vital structural details - including lattice or polymer structures, spin waves, crystal orientation and phonon modes - can be clearly distinguished. Since these vibrational energies correspond to molecular transitions and vibrations in the 5 cm-1 to 200 cm-1 range (equivalent to 0.15 to 6.0 THz), the term “THz-Raman®” has been used for describing this new spectral region and the associated instrumentation (Figure 1).
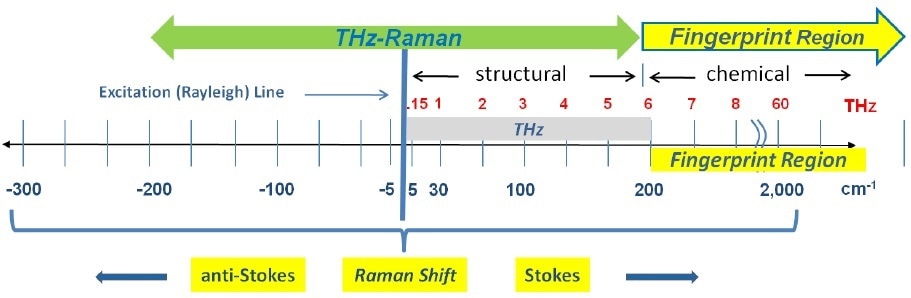
Figure 1. Spectral range of THz-Raman spectroscopy showing both fingerprint and THz-Raman regions.
THz-Raman is rapidly achieving significant interest and application as an important new tool for Chemists across the industrial, pharmaceutical and petro-chemical industries. In addition to providing unambiguous, fast differentiation of polymorphs, THz-Raman can also be used to distinguish raw materials, synthetic pathways and contaminants, as well as enhancing counterfeit detection and surety testing.
THz-Raman systems boost total Raman intensity and enhance SNR by incorporating both low-frequency (low wavenumber) and anti-Stokes signals. Additionally, the symmetrical nature of the anti-Stokes signals behave as a confirmation of Stokes peaks as well as providing an inherent self-calibration capability and improving overall reliability. THz-Raman systems provide unambiguous, fast differentiation of polymorphs, while preserving the complete Raman “fingerprint region” for chemical identification and analysis.
Polymorph Detection
Figures 2 and 3 establish the efficiency of THz-Raman for detection of polymorphs. Carbamazepine (CBZ) is an anticonvulsant and mood-stabilizing drug generally prescribed in the treatment of bipolar disorder and epilepsy. It comprises of four different polymorphic forms that have been well characterized in the literature1,2,3,4,5 with form three being the active pharmaceutical ingredient. Pure samples of form two and form three as well as the hydrated form were obtained and the entire Raman spectra was measured with an THz-Raman® XLF-CLM system (spectra shown in Figure 2, system shown in Figure 7).
The fingerprint region signals are very similar because of the similarities of chemical composition. However, the differences in molecular structural can be effortlessly seen in the THz-Raman region, with signal intensities of up to 4.5 times those in the fingerprint region. Figure 3 displays an expanded view of CBZ polymorphs, including the hydrated form, in the THz-Raman regime. Note the symmetry of anti-Stokes signals across the laser line, which additionally serve to confirm the low-frequency measurements and offer additional signal that can be used for boosting the detection sensitivity of the system.
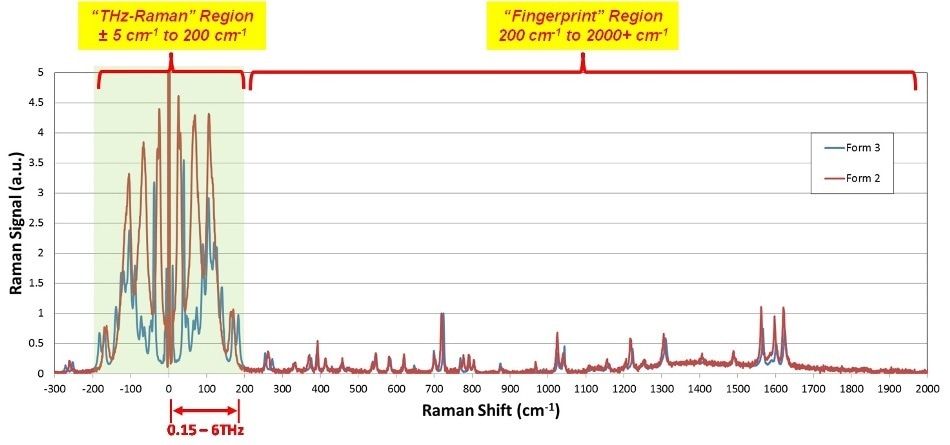
Figure 2. Complete Raman spectra of Carbamazepine Polymorphs Forms 2 and 3. Note much clearer differentiation in the THz-Raman region, as well as peak intensities more than 4x those in the fingerprint region.
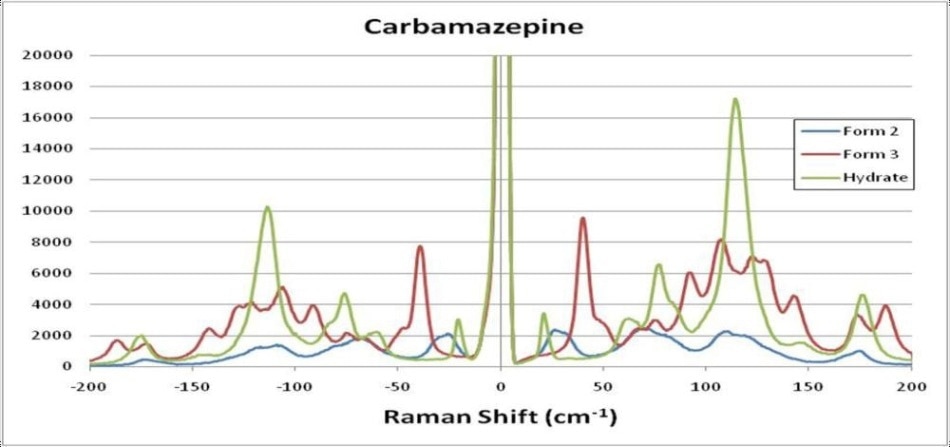
Figure 3. Expanded view of THz-Raman spectra of Carbamazepine polymorphs, including the hydrated form.
Many other common APIs exhibit polymorphs. Figure 4 displays another example of complete Raman spectra for varied polymorphs of Indomethacin (IDM), Acetaminophen (APAP) and Probucol (PBC). These confirm the general trend that THz-Raman spectra are both much greater in intensity, and more easily distinguishable than signals in the fingerprint region.
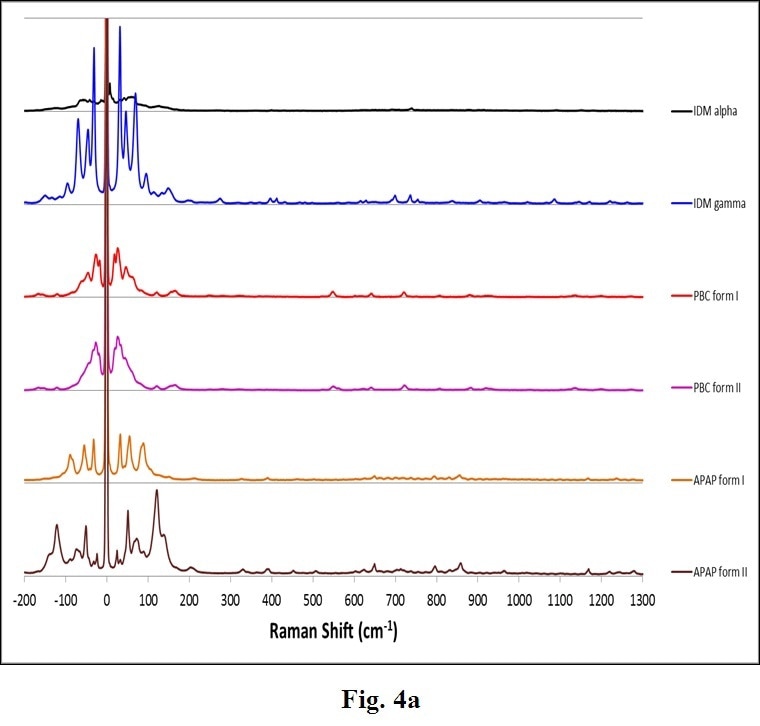
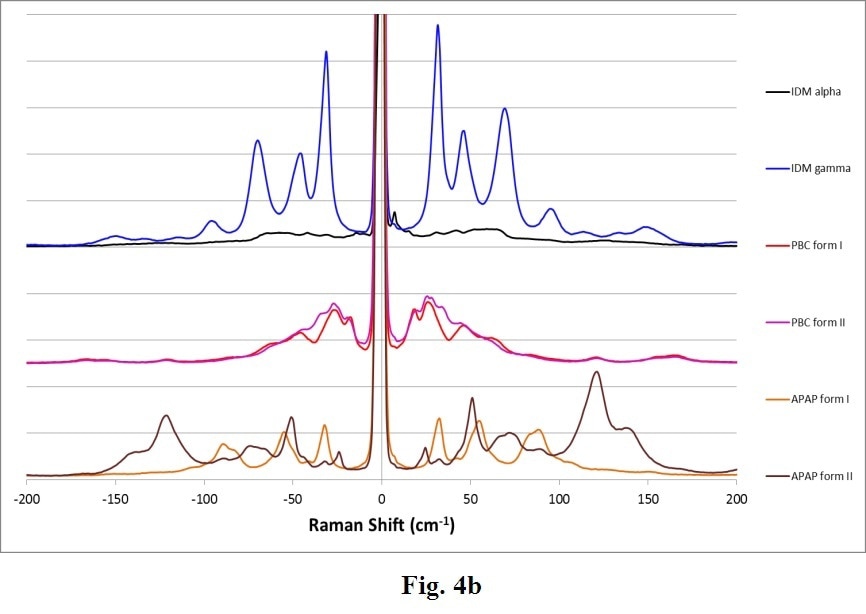
Figure 4. Complete Raman spectra (a) of polymorphs of several APIs: Indomethacin (IDM alpha & gamma), Probucol (PBC forms I & II) and Acetaminophen (APAP forms I and II). Note the stronger intensity (a) and clearer differentiation of peaks in the THz-Raman region (b). (Samples and spectra courtesy Dr. Tatsuo Koide, National Institute of Health Sciences, Division of Drugs, Tokyo, Japan and Dr. Toshiro Fukami, Nihon University, School of Pharmacy, Funabashi, Japan).
Phase and Crystal Monitoring
Real-time monitoring of phase changes or crystallization are two other vital applications in pharmaceutical and industrial chemistry. A good demonstration of the benefits of THz-Raman for phase monitoring can be seen in Sulfur, which develops more than 30 different allotropes6. The easiest to produce and most common are forms α, β and λ.
A sample of α sulfur was placed on a microscope slide and then heated with a hot plate while measuring the Raman spectra with the THz-Raman system as a function of temperature, using 80 mW of 785 nm laser power on the sample and 10 seconds of total integration time at each temperature setting (Figure 5). When the sample temperature was increased above 95.2 °C, the form changed from α to β, and then changed again to λ at the melting point of 115.21 °C. Note that while there are clearly recognizable variations in both peak location and magnitude in the THz-Raman region, there is no noticeable shift in the position of the peaks in the Raman fingerprint region.
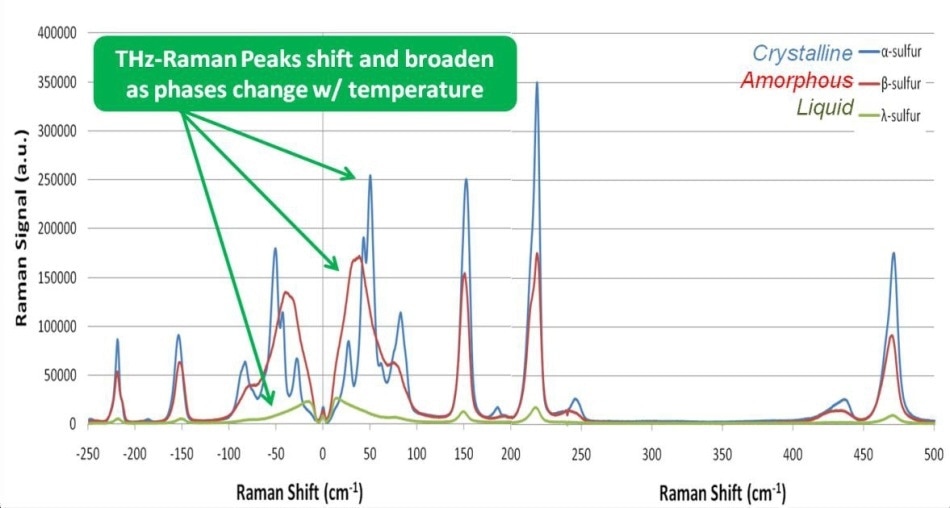
Figure 5. Monitoring phase changes in Sulfur. As the phase shifts from highly crystalline (α phase) to amorphous (β phase) to liquid (λ phase), THz-Raman peaks can be seen to shift and broaden.
Monitoring the formation or presence of cocrystals is also improved using THz-Raman spectra. Figure 6 displays the clearly recognizable peak shifts that take place when cocrystals are formed in a mixture of 2-Benzoic acid and Caffeine.
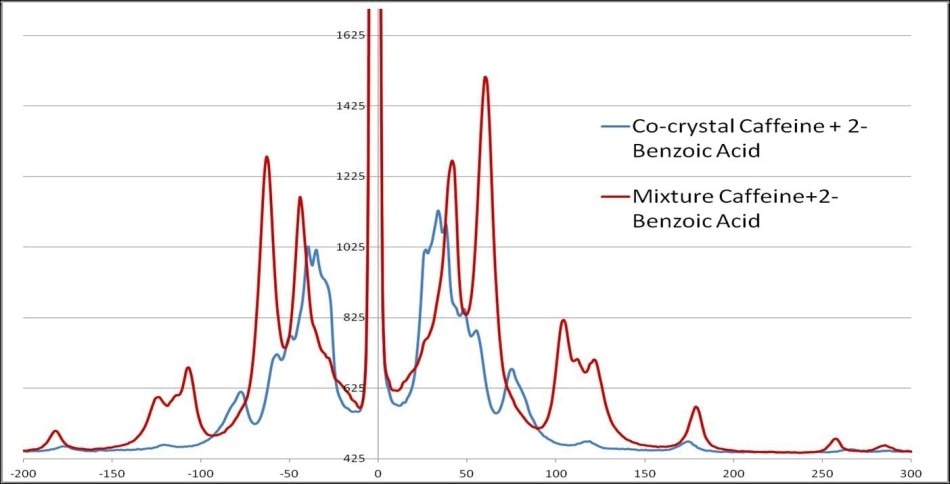
Figure 6. THz-Raman spectra of caffeine and 2-benzoic acid, showing the shift in spectra when cocrystals are formed.
THz-Raman Instrumentation
The unique, patented Coherent THz-Raman® platform used for these measurements employs a series of proprietary ultra-narrow-band volume holographic grating (VHG) notch filters, which are capable of comprehensively and precisely blocking just the Rayleigh excitation without compromising any of the Raman scattering signature.
By comparison, most commercial Raman systems make use of thin film edge filters which will completely remove both the Rayleigh excitation as well as all anti-Stokes signals and typically cut off all signals below about 200 cm-1. Even the best edge-filter systems will typically block all signals below 50 cm-1.
An alternative approach is to use notch filters, which will allow capture of anti-Stokes signals, but do not have adequately narrow bandwidth in order to allow capture of low-frequency signals. Finally, it is possible to use a multi-stage (or cascaded) monochromator system, but it is large, expensive and complex; furthermore it drastically decreases the overall Raman signal and cannot capture anti-Stokes signals in a simultaneous manner.
Recent improvements in volume holographic grating (VHG) filter technology have enabled the manufacture of these exceptionally narrow bandwidth notch filters with extremely high throughput7. This has resulted in systems that are capable of rapid acquisition of high-quality, ultra-low frequency Raman spectra in the ±5-200 cm-1 region (Figure 7)8,9. These systems are based on a compact series of VHG filters, a stabilized wavelength diode laser source and a single stage spectrograph (Figure 8). Each VHG filter comprises of a notch profile that is designed to diffract only one particular wavelength matching the laser and transmit all other wavelengths.
The ultra-narrow transition bandwidth of these filters enables very high attenuation of the laser wavelength (system >OD 9), while maintaining extremely high transmission of nearby Raman signals beyond ~5 cm-1. This combination of high broadband transmission and strong Rayleigh attenuation enable the system to simultaneously capture both the intense low-frequency Raman bands and fingerprint region transitions, majorly simplifying the overall system and decreasing the cost, while enhancing the reliability and sensitivity of using Raman for polymorph identification and other applications. The entire laser and filter assembly is also exceptionally compact, and the low power needs of the laser make the system operable by battery supply if required.
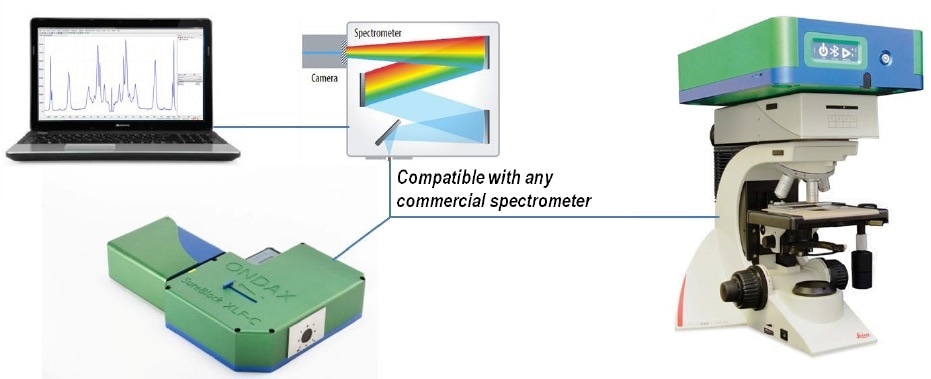
Figure 7. THz-Raman® Spectroscopy systems come in either benchtop or microscope configurations. Benchtop systems come with a convenient vial holder for sample measurements.
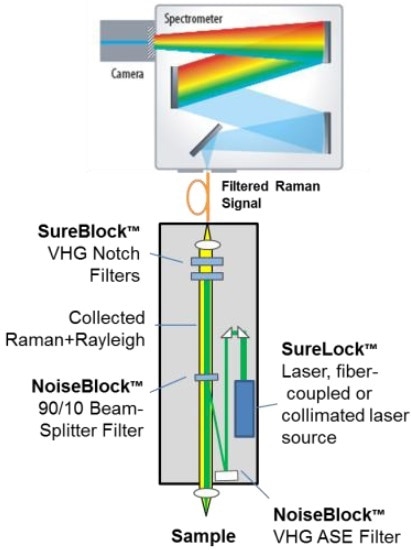
Figure 8. System schematic of a THz-Raman spectrometer platform, showing multiple VHG filters and a wavelength stabilized laser.
The ultra-narrow bandwidth of the VHG filters (<0.1 nm) also needs the laser to have a wavelength that is very stable. Non-stabilized diode lasers tend to be highly subject to mode hops which can move the laser wavelength outside the blocking range of the filters, resulting in either reduced Rayleigh suppression or a total loss of signal in the described configuration.
DPSS lasers and Gas lasers are normally sufficiently narrow in stability and linewidth in order to work with VHG filters; however, they are restricted to visible wavelengths which can cause fluorescence in many materials. It is possible to stabilize both visible and NIR diode lasers by using VHG filters in order to provide the stable, single-frequency performance needed for THz-Raman systems.
Conclusion
Differences in manufacturing and formulation processes, ingredients, synthetic pathways and environmental conditions (including pressure, solvents, temperature, contaminants, etc.) can bring about changes in molecular structure. THz-Raman makes it possible to actively monitor – in real time and with a single instrument – structural changes during formulation, processing or packaging in order to guarantee the integrity and quality of the material.
THz-Raman signals are a lot stronger in intensity and more clearly differentiating than those in the fingerprint region, and the addition of anti-Stokes signals also improves total SNR and the spectral symmetry provides an inherent calibration reference, thus removing concerns about ongoing calibration. The affordable and compact nature of the system enables it to be effortlessly configured for application-specific uses or incorporated into existing Raman systems.
By promising enhanced speed, reliability and simplicity of polymorph detection, as well as overall chemical analysis, THz-Raman is now becoming a vital new tool for the pharmaceutical industry to drive manufacturing process advances, reduce manufacturing costs and increase total yields and safety. Besides polymorph identification, there are several other applications where THz-Raman signals can be used in order to gain significant new information about materials and boost system sensitivity, including polymer and industrial chemical development and manufacturing, explosives trace detection and forensics, basic material science and cancer detection. These new platforms are capable of opening up the possibility of using THz-Raman for these and several other scientific and industrial uses in the years to come.
References and Further Reading
- Pohlmann H, Gulde C, Jahn R, Pfeifer S. 1975.Polymorphism, particle-size and blood level values of carbamazepine. Pharmazie 30:709–711.
- Lefebvre C, Guyot-Hermann AM, Draguet-Brughmans M, Bouche R, Guyot JC. 1986. Polymorphic transitions of carbamazepine during grinding and compression. Drug Dev Ind Pharm 12:1913–1927.
- Rustichelli C, Gamberini G, Ferioli V, Gamberini MC, Ficarra R, Tommasini S. 2000. Solid-state study of polymorphic drugs: Carbamazepine. J Pharm Biomed Anal 23:41–54.
- Lang M, Kampf JW, Matzger AJ. 2002. Form IV of carbamazepine. J Pharm Sci 91:1186–1190.
- Day et. al. “Understanding the Influence of Polymorphism on Phonon Spectra: Lattice Dynamics Calculations and Terahertz Spectroscopy of Carbamazepine”, J. Phys. Chem. B 2006, 110, 447-456
- Steudel, Ralf; Eckert, Bodo (2003). "Solid Sulfur Allotropes Sulfur Allotropes". Topics in Current Chemistry. Topics in Current Chemistry 230: 1–80. doi:10.1007/b12110. ISBN 978-3-540-40191-9.
- Moser, C and Havermeyer, F., Appl. Phys., 95, 3, 597–601 (2009).
- Moser, C., Havermeyer, F., Compact Raman spectrometer system for low frequency spectroscopy Proc. SPIE 7598, Optical Components and Materials VII, 75980S (2010)
- Carriere, J. , Havermeyer, F. Ultra-low frequency Stokes and anti-Stokes Raman spectroscopy at 785nm with volume holographic grating filters, Proc. SPIE 8219, Biomedical Vibrational Spectroscopy V: Advances in Research and Industry, 821905 (2012)

This information has been sourced, reviewed and adapted from materials provided by Coherent.
For more information on this source, please visit Coherent.