Spectroscopy can be thought of as the study of how light and matter interact. To help understand this, light can be separated into different regions of the electromagnetic spectrum as illustrated in Figure 1.
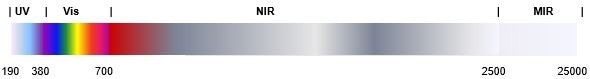
Figure 1. The electromagnetic spectrum between 190 nm to 25,000 nm
Spectroscopy is well suited for the monitoring of continuous and batch processes and can provide accurate real-time analysis. Different regions of the spectrum such as the near infrared (NIR), as well as the ultraviolet and visible (UV-VIS) can provide huge amounts of information about many physical and chemical properties to help operators better control their processes.
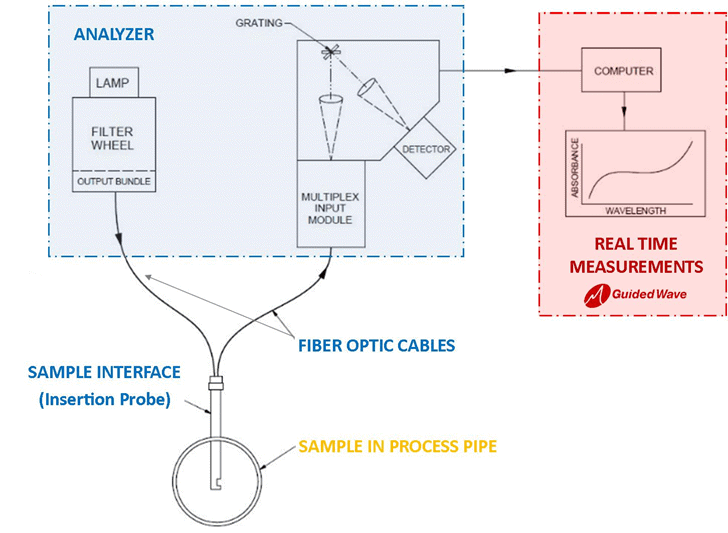
The acquisition speed and the wide range of measurements that can be carried out by a fiber optic-based spectrometer are unmatched by any other technology. This technique can achieve comprehensive data sets, that would normally take hours of laboratory analyses to acquire, in under a minute.
Beginnings of Spectroscopy
The earliest spectrometers employed prisms to separate the different wavelengths of visible light. However, as scientists began to move from studying light in the visible and near-infrared parts of the spectrum to light in the mid-infrared region, they found that the prisms and gratings of the early 1900s were noisy, slow, and provided limited resolution.
A solution to these problems in mid-infrared spectroscopy was eventually found by Michelson, who presented a range of new interferometer designs.

Modern Spectroscopy
In the late 20th century the optics, electronics, and other components inside spectrometer systems continued to improve. Dispersive spectrometers used today separate the wavelengths of light using highly engineered gratings, which also help to reduce stray light.
A diffraction grating is generally an aluminum-coated mirror, into the surface of which thousands equally spaced, parallel grooves have been etched. As a result, gratings are some of the most precise objects ever made - the way in which these gratings work is described in most good college physics textbooks.
In a peer-reviewed study by Coates, it was found that Fourier Transform Spectrometers (FT-NIR) and Dispersive Analyzers (DG-NIR) have equivalent performance (Coates, 1994 NIR news DOI:10.1255/nirn.250). The results of this study demonstrate that with modern technology, many of the claimed advantages provided by FT-NIR Spectrometers are no longer valid. Given this, how can you decide which spectrometer technology is the best choice for your analysis?
Which Technology is a Better Choice?
FT-NIR is a powerful technique, particularly in a laboratory setting in which samples can be introduced to the spectrometer without the use of an optical fiber. FT spectrometers also work well for measuring samples in reflection, such as solids or powders. When considering NIR for the measurement of “clear” liquids or gases using optical fibers, many of the advantages of FT-NIR instruments are lost.
The bandwidth of spectral features depends on the state of the sample. Gases and vapors have very narrow spectral features (lines) that can require high resolution to be observed. Solids and liquids present very broad spectral features (bands) as a result of the hindered rotation of molecules within the material matrix. As a result, bandwidths for clear liquid hydrocarbon samples (which make up the bulk of NIR applications) range from 2-12 nm.
For aqueous samples this is broader still. Thus, in the case of condensed samples, the high resolution provided by FT-NIR is neither required nor desirable, since high resolution comes at the cost of a lower signal-to-noise ratio (SNR). For chemometric analysis of complex hydrocarbon mixtures, SNR is the more important factor for accurate analysis.
In fact, a scanning grating dual-beam spectrometer (DG-NIR) produces a better signal-to-noise ratio (i.e., improved sensitivity at lower detection limits) and superior stability to withstand ambient air fluctuations. What’s more, the dual-beam operation provides the additional benefit of superior long-term stability, which can be required by process analyzers that must operate unattended for long periods.
While dual-beam operation is easy to implement in instruments that use a grating, it is more difficult in an FT-NIR analyzer. As most FT-NIR analyzers do not operate in dual-beam, they require more frequent referencing in order to compensate for photometric drift.
Advancements in Spectroscopy
Since the publication of Coates’ report in 1994, dispersive analyzers been advanced further with the full spectrum post dispersive planar grating, dual-beam (DG-NIR) technology, developed by Process Insights. The application of these advancements to NIR process analyzers will ensure accuracy as a result of the reduction of stray light and provide an excellent signal-to-noise ratio.
Lowering Black-Body Impact with Post-Dispersed Design
Post-dispersed design means that ambient or black-body radiation can be dispersed in a similar way to all other radiation, so that for any given wavelength, its impact will be reduced.
Improving Efficiency with the Use of a Plane Grating
The majority of commercial grating spectrometers employ concave holographic gratings, as the optical systems in this setup are very simple. However, concave gratings always introduce off-axis aberrations such as coma and astigmatism, which rob light from the image.
Holographic gratings are difficult to blaze, and so are not very bright at the angles of use, again robbing light from the image. Instead of using a concave grating, GWI uses a more efficient design: a highly blazed plane grating.
A pair of triplet achromatic lenses provides collimation and focusing. These lenses produce an image of the source fiber in the focal plane of the spectrometer which is virtually free of aberration. This results in a spectrometer of exceptional brightness, i.e., throughput, and therefore provides a very high signal-to-noise ratio.
Additional Comparisons and Considerations: Analyzer Validation
One important consideration for successful process monitoring is the ability to monitor the accuracy and precision of the system on a continuous basis, thus ensuring that the spectra produced by the analyzer are validated for your applications.
In the case of FT-NIR analyzers, validation is often carried out using external fluids such as Pentane and Toluene, which can be expensive and rarely available consumables. Pentane is used as a wash fluid, while Spectroscopic Grade Toluene is required as the validation sample. Industrial grade Toluene cannot be used for this purpose.
Validation can either be automated or run manually, but additional plumbing is required to inject the sample on the probe. As a result, validation reduces the analyzer up-time and adds complexity (meaning more potential failure points) to the sample handling system.
The validation system used in Process Insights’ DG-NIR analyzer is simple and requires no consumables or maintenance. Using the optional Stability Monitoring System (SMS) in the analyzer, there is no need for the other channel operation to be interrupted. It provides continuous and automatic analyzer validation according to ASTM methodology.
Maintenance
It is important to consider the ongoing costs and the ease of use associated with any instrument. Both FT-NIR and DG-NIR spectrometers use tungsten-halogen lamps as the light source and an InGaAs detector.
Lamp replacement in DG-NIR spectrometers is typically required every six months, and is the only consumable needed. All the lamps are pre-aligned, meaning that the replacement of this light source can be completed by anyone in a matter of seconds.
The lamp must also be periodically replaced in FT-NIRs. Furthermore, the laser itself has a finite lifetime and occasionally requires replacement. Replacing the laser is not a simple process, as it must be carefully aligned to the white light beam from the lamp. As a result, laser replacement is often done by a factory trained service engineer.
Multiplexing Facility - The Input Module
FT-NIR spectrometers can be multiplexed (multi-channel operation) but this often requires fiber multiplexers with moving optical elements. It is not possible to move optical elements without introducing some noise into the system.
On-line spectroscopy often requires SNRs > 105 which is beyond the capability of moving optical element multiplexers. The additional hardware cost limits the number of channels to between 2 and 8.
An alternative means of multiplexing is stream switching. This involves an extractive sample system with motor operated valves and introduces the possibility of cross contamination in the sample cell. This is a slow, high maintenance approach.
Process Insights’ DG-NIR analyzers have built in multiplexing without any moving optical elements. Thus there is no degradation in the SNR. A DG-NIR system with twelve channels can switch between samples in seconds.
Conclusion: DG-NIR Advantage
When considering NIR for an application involving a “clear” gas or liquid, a dispersive NIR Spectrometer, DG-NIR is the superior choice. By developing NIR analyzers with dual-beam, post-dispersive planar gratings, the scientists and engineers at Process Insights have advanced the state-of-the-art in dispersive NIR technology.
By incorporating these improvements without compromising the dual-beam operation, Process Insights can provide a DG-NIR analyzer with superior resolution and accuracy. The DG-NIR advantage is a result of the way these analyzers are designed to control light, minimizing all forms of aberrations.
The DG-NIR system has been carefully optimized in order to provide excellent signal-to-noise ratio, excellent long-term photometric and wavelength stability, built-in multiplexing, and ease of maintenance.

This information has been sourced, reviewed and adapted from materials provided by Process Insights – Optical Absorption Spectroscopy.
For more information on this source, please visit Process Insights – Optical Absorption Spectroscopy.