As today’s industries strive to improve efficiency and performance while reducing costs, innovative new materials are being tested, developed, and brought to market. From raw material quality control to failure analysis, elemental characterization is a critical part of this lifecycle.
Despite its importance, performing elemental characterization is difficult and time-consuming, requiring multiple analytical instruments, complicated operational and calibration procedures, and trained chemists.
Traditional mass spectrometry and spectroscopy techniques involve digesting solid material with acid for the most accurate elemental analyses. This results in a bulk composition of the material only and fails to identify how elements change spatially or in depth. Investigating elements’ spatial distributions is especially critical for diagnosing failures in the manufacturing process or after use.
To access spatial elemental data, some users combine mass spectrometry techniques with laser ablation instruments. Due to the complexity of each part of the combined laser ablation and spectroscopy system and lack of continuity between different configurations and vendor combinations, there are still numerous challenges in data collection and processing.
Another approach is to apply scanning electron microscopy with energy dispersive X-ray spectroscopy (SEM-EDX). This can be easier to use than other spectroscopy tools that require liquid sample introduction, but it does not provide high-sensitivity elemental results.
Because the detection limits of SEM-EDX are typically in the weight percent or high thousands of parts per million, its elemental mapping is limited to major elements only. Elements in the low parts-per-million (ppm) range are not detected.
LALI-TOF-MS (Massbox)
Massbox's Laser Ablation Laser Ionization Time of Flight Mass Spectrometry (LALI-TOF-MS) addresses many of the difficulties associated with other analytical techniques, providing rapid, high-sensitivity quantification of nearly the entire periodic table.
The ionization source, LALI, employs two lasers to first ablate, or release, material from the surface of a solid sample and subsequently ionize the neutrals present in the ablated material.
The laser ablation process permits direct analysis of solid materials, spanning from raw material to final product, without the complex sample preparation procedures required by other techniques that necessitate liquid sample introduction.
The neutral particles generated by ablation are targeted by the ionization laser. The resulting ions more accurately represent the sample’s constituents compared to plasma-generated ions.
Overall, LALI facilitates more reliable elemental verification and mitigates sample matrix effects. Following ionization, the TOF mass analyzer generates a complete mass spectrum at each laser spot. The software then verifies each detected element based on naturally occurring isotope patterns.
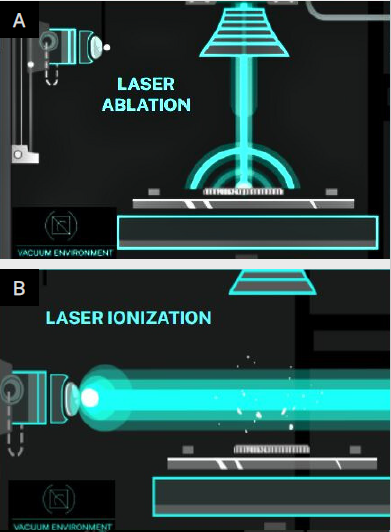
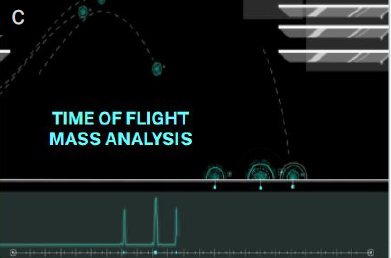
Figure 1. A) Ablation laser fires perpendicular to the sample's surface. The laser spot size is adjustable from 5-150 microns; B) Secondary laser performs multiphoton ionization of neutral particles created by the ablation process; C) Ions are separated by Time-of-Flight mass spectrometry and detected with a multichannel plate (MCP). Image Credit: Exum Instruments
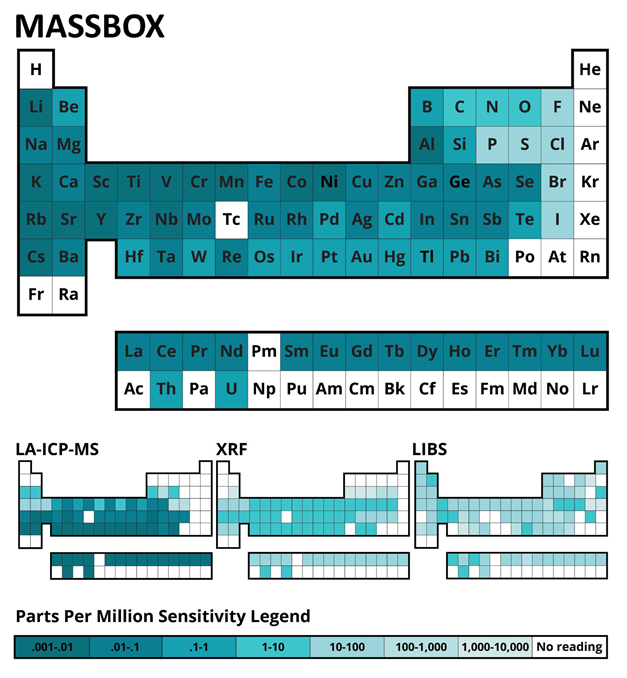
Figure 2. Detection limits for Massbox, LA-ICP-MS (Laser Ablation Inductively Coupled Plasma Mass Spectrometry), XRF (X-ray Fluorescence), and LIBS (Laser Induced Breakdown Spectroscopy). Each element is colored by its respective limit of detection. Darker colors represent lower detection limits. Image Credit: Exum Instruments
Elemental Mapping
As well as bulk characterization, Massbox is capable of performing elemental mapping. During each analytical session, it can analyze an area of up to 83 mm by 83 mm.
The spatial resolution of the resulting map is determined by the adjustable spot size of the ablation laser, which ranges from 5 to 150 microns. Each laser spot produces a complete mass spectrum of data, allowing the resulting map to illustrate the variation of any element of interest.
Figure 3 presents an example set of maps obtained from a multi-material additive manufacturing build. In each map, the color scale denotes the relative concentration of the elements, with warm colors (e.g., red) indicating higher concentrations and cool colors (e.g., green) representing lower concentrations.
This 3D-printed specimen was constructed from Stainless Steel 316L (right) transitioning to nickel alloy, Nickel Alloy 718 (left). The Massbox analyzed a 25 mm by 5 mm area across the discrete interface between the materials.
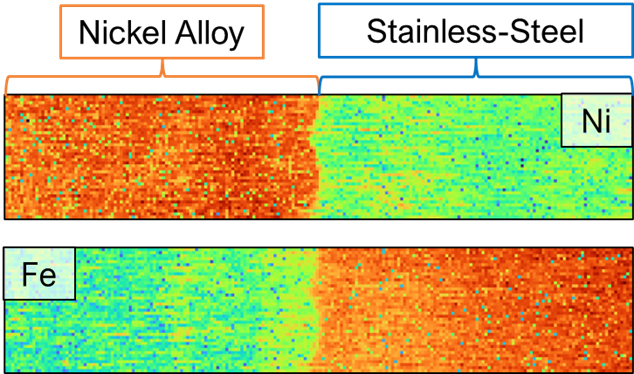
Figure 3. Mapping results acquired by the Massbox on a multi-material additive manufacturing sample, a tensile bar built from Stainless-Steel 316L transitioning to nickel alloy, Nickel Alloy 718. The 25-mm-by-5-mm maps have spatial resolutions of 120 microns. The top map shows the distribution of nickel (Ni) and the bottom map shows the distribution of iron (Fe). Mapping results clearly demonstrate the nickel alloy with relatively high Ni concentrations on the left and stainless steel with relatively high Fe concentrations on the right. Image Credit: Exum Instruments
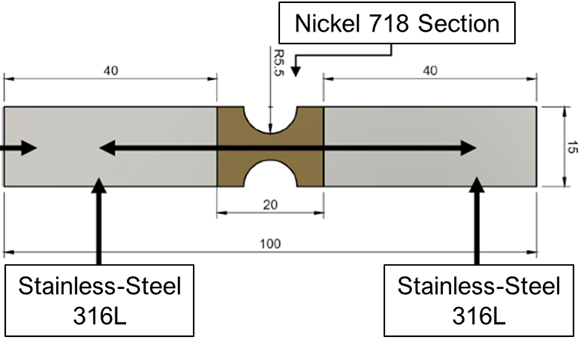
Figure 4. Diagram of the multi-material additively manufactured tensile bar. Multimaterial additive manufacturing enables the development of strategically enhanced components. Here, the tensile bar’s notch was strengthened with Inconel 718 (nickel alloy), which has higher strength than the Stainless-Steel 316L used in the tensile bar’s grips. The tensile bar was built using Directed Energy Deposition. Image Credit: Exum Instruments
Multi-Material Interface Analysis
Figure 3 shows the resulting maps from analyzing a 25 mm by 5 mm area using a 120-micron laser spot size. This relatively large spot size produces a coarse map that helps identify the transition zone between the nickel alloy and stainless steel on the tensile bar specimen.
Once this area of interest is located, the user can then generate a higher-resolution map using a smaller laser spot size, as demonstrated in Figure 5. This higher-resolution mapping enables more detailed characterization of the material interface.
High-Resolution Interface Mapping
To characterize the interface further, Massbox conducted higher-resolution elemental mapping using a 25 micron laser spot over a 7.5 mm by 6 mm area.
The results revealed a distinct region of mixed chemistry between the two materials. The dimensions of the mixed chemistry interface correspond to the laser diameter employed in the Directed Energy Deposition 3D-printing process, and the curved pattern observed indicates the melt pool.
Such insights are essential for understanding melt pool mixing and enhancing process control in multi-material additive manufacturing.
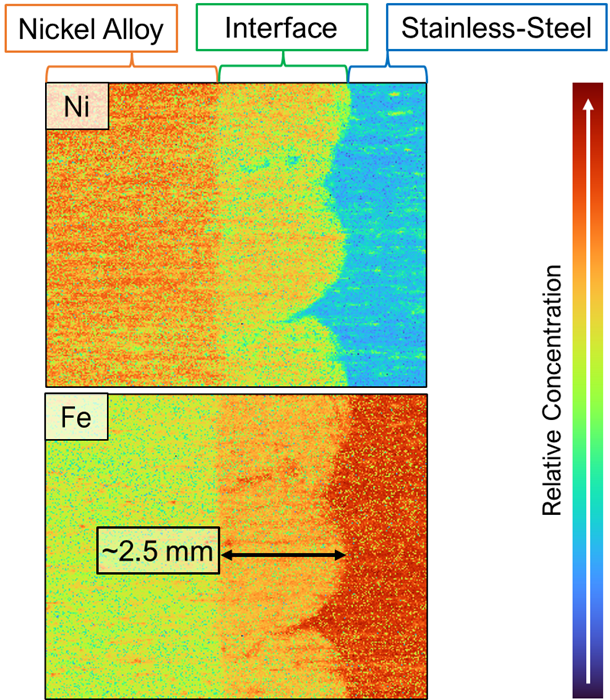
Figure 5. Elemental mapping results from a multi-material additive manufacturing specimen of Stainless-Steel 316L and nickel alloy, Inconel 718. The color scale indicates relative concentrations of Ni (top map) and Fe (bottom map) with warmer colors (e.g., red) indicating higher concentrations. The area analyzed is 7.5 mm by 6 mm with a mapping resolution of 25 microns. Image Credit: Exum Instruments
3D Elemental Mapping
In addition to the 2D elemental maps presented in this study, the Massbox offers advanced 3D characterization capabilities. Because the Massbox’s LALI technique ablates and removes material during analysis, repeating the mapping process enables users to examine multiple layers, resulting in 3D reconstructions of any solid material.
Each pulse of the ablation laser removes tens to hundreds of nanometers of material, supporting high-resolution depth profiling. The amount of material removed per layer can be precisely controlled by adjusting the laser’s power and the overlap between pixels. To probe through hundreds of microns, users can apply higher laser power and increase spot overlap.
Each voxel in the 3D reconstruction contains a full mass spectrum, giving users detailed insight into the spatial distribution of any element of interest. This capability is especially valuable for analyzing complex, multi-layered materials such as coatings, oxide layers, and surface contaminants.
Massbox uniquely combines nanometer-scale resolution with depth profiling that extends through hundreds of microns, making it a powerful tool for a wide range of materials applications.
Conclusions
This study demonstrates how the Massbox supports the development and manufacturing of innovative materials and products.
Characterizing the interface between two materials is especially important for refining multi-material additive manufacturing processes. In this case, a 3D-printed tensile bar specimen was loaded directly into Massbox—no sample preparation required.
A quick scan using a 120-micron laser spot size helped locate the interface between stainless steel and nickel alloy. A higher-resolution elemental map (25 microns) then revealed a distinct region of mixed chemistry, corresponding to the melt pool created during the Directed Energy Deposition process.
These insights will guide future iterations in developing functionally graded materials.
Beyond the elemental mapping shown here, Massbox offers quantitative analysis across the full periodic table, rapid screening of unknown materials, and depth profiling—all in one system.
By integrating these capabilities into a single desktop instrument, Massbox streamlines discovery and development. Rather than relying on multiple instruments and test methods, users can obtain complete chemical characterization in a single analytical session.
Additionally, because all analyses are conducted under vacuum, Massbox is well suited for examining air- and moisture-sensitive materials.
Image Credit: Exum Instruments

This information has been sourced, reviewed and adapted from materials provided by Exum Instruments.
For more information on this source, please visit Exum Instruments.