In the battery industry, the drive for greater energy efficiency, improved safety, and cost reduction continues to fuel the search for advanced chemistries and novel cell geometries.
Elemental characterization plays a vital role throughout the battery lifecycle, from raw material quality control to post-cycling failure analysis. Common techniques used for elemental analysis include spectroscopy and mass spectrometry for detecting trace elements in raw materials, and X-ray-based methods for non-destructive electrode characterization.
While effective for many applications, these methods fall short when it comes to quantitatively mapping lithium distribution in battery electrodes, both spatially and in depth.
Understanding lithium distribution is crucial for improving battery performance, capacity, and longevity. It helps scientists develop advanced chemistries and engineers optimize electrode geometry.
The first step is identifying where recoverable lithium is located and determining how much lithium has become nonrecoverable. It is then essential to assess whether this nonrecoverable lithium has formed part of the solid electrolyte interphase (SEI) layer or has accumulated as harmful lithium plating.
Addressing these questions requires a three-dimensional view of lithium, its species, and the surrounding elements.
Until now, no instrument has been able to reliably generate both elemental maps and depth profiles of lithium in air-sensitive battery electrodes.
LALI-TOF-MS (Massbox)
Using Laser Ablation Laser Ionization Time-of-Flight Mass Spectrometry (LALI-TOF-MS), Massbox addresses many of the limitations associated with traditional spectroscopy and X-ray-based techniques.
Operating under vacuum, it can directly analyze air- and moisture-sensitive solid materials. This compact, desktop system delivers spatial mapping and depth profiling in addition to bulk elemental characterization. Notably, it can detect low-mass elements, such as lithium, carbon, oxygen, and fluorine, that conventional instruments often struggle to measure at trace levels.
Massbox employs two lasers: one to ablate material from the sample surface and another to ionize the resulting neutral particles. This approach enables direct solid analysis without complex sample preparation. By specifically targeting neutral particles, the ionization laser reduces sample matrix effects and produces more representative results, improving elemental verification.
A time-of-flight (TOF) mass analyzer captures a full mass spectrum at each laser spot, allowing users to examine every detected element. The software confirms each element through its naturally occurring isotope patterns.
Designed with accessibility in mind, the Massbox’s intuitive software simplifies data interpretation, making this advanced analytical tool usable by professionals regardless of their chemistry expertise.
Testing Silicon Anodes
This study focused on analyzing a set of pristine and cycled silicon anodes to characterize lithium distribution and identify any other chemical differences between the samples.
Figure 2 displays the three anodes.
The pristine sample had never been assembled into a cell, while the two cycled anodes were assembled as half-cells, charged and discharged once, and then disassembled for analysis. Each of the cycled anodes underwent the charge-discharge cycle at a different rate.
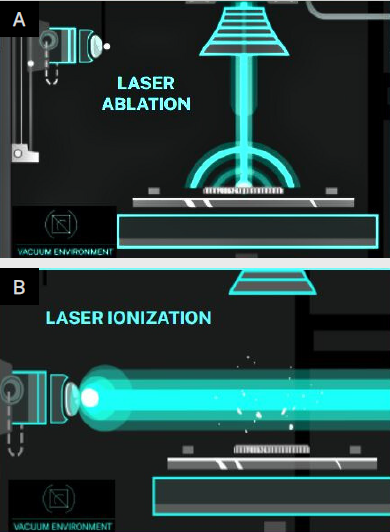
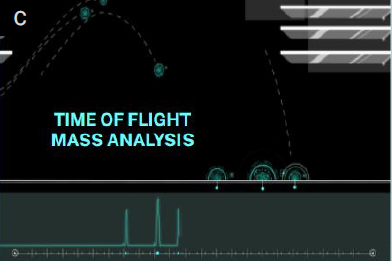
Figure 1. A) Ablation laser fires perpendicular to the sample's surface. The laser spot size is adjustable from 5-150 micron; B) Secondary laser performs multiphoton ionization of neutral particles created by ablation process; C) Ions are separated by Time-of-Flight mass spectrometry and detected with a multichannel plate (MCP). Image Credit: Exum Instruments
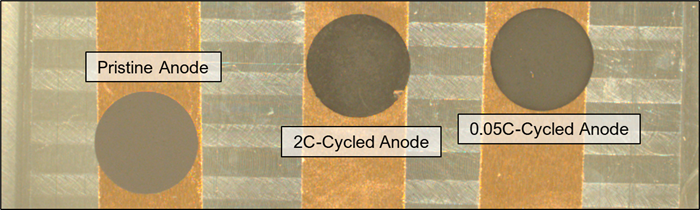
Figure 2. Image of the three study samples taken by the Massbox’s macrocamera. Pristine Anode: This freshly manufactured silicon anode had never been assembled into a cell. 2C-Cycled Anode: This silicon anode was charged and discharged at a 2C (fast) rate. 0.05C-Cycled Anode: This silicon anode was charged and discharged at a 0.05C (slow) rate. Image Credit: Exum Instruments
Elemental Mapping
Massbox enables detailed areal characterization through elemental mapping. With the capability to analyze areas up to 83 mm by 83 mm and spatial resolution adjustable from 5 to 150 microns, it provides a comprehensive view of elemental distributions. Each laser spot generates a full mass spectrum, allowing users to map any element of interest.
The lithium maps shown in Figure 3 were acquired from the silicon anode set. For each sample, Massbox scanned a relatively large area (4.95 mm by 3.9 mm) using a 50-micron laser spot size. These maps illustrate lithium distribution, with brighter colors indicating regions of higher concentration.
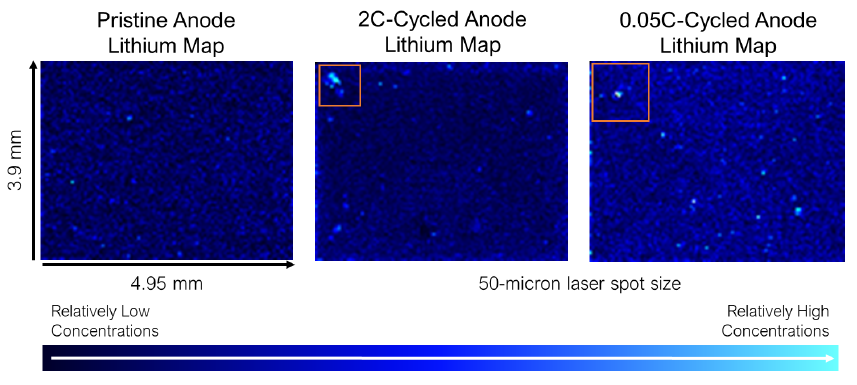
Figure 3. Lithium maps acquired on a set of silicon anodes. Bright blues indicate areas of relatively high lithium concentrations on the cycled anodes. Ideally, cycled anodes will lithiate evenly, and it is important to investigate areas of lithium accumulation as potential failure sites. Image Credit: Exum Instruments
To further characterize areas of high lithium concentration on the cycled anodes, higher resolution mapping was performed with a 30-micron ablation laser spot size. Compared to the slower-cycled anode, the 2C-Cycled Anode exhibited larger regions of lithium accumulation, which corresponded to significantly lower relative concentrations of silicon.
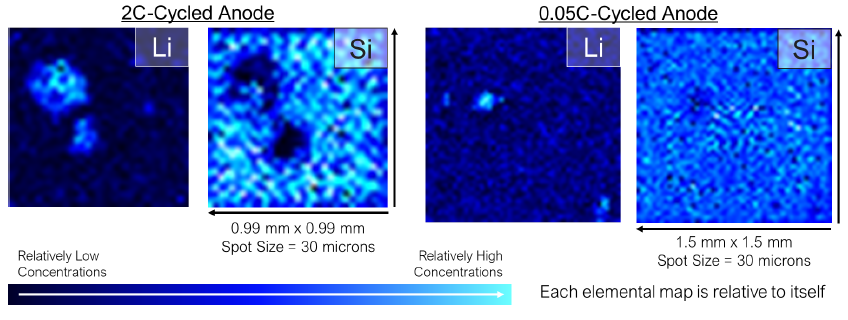
Figure 4. The left set of maps were acquired on a 0.99-mm-by-0.99-mm area on the 2C-Cycled Anode. The right set of maps were from a 1.5-mm-by-1.5-mm area on the 0.05C-Cycled Anode. Image Credit: Exum Instruments
Lithium Distribution
As expected, the lithium map for the Pristine Anode, shown in Figure 3, was homogeneous with no significant accumulations of lithium. In contrast, the lithium maps for the cycled anodes revealed bright blue “hot spots” that indicate areas of high lithium concentration.
Further examination of the bright blue regions depicted in Figure 4 highlighted distinct differences between the two charge rates. On the 0.05C-Cycled Anode, regions of high lithium accumulation, approximately 100 microns in size, correspond to slightly lower silicon concentrations.
Conversely, the areas of high lithium on the 2C-Cycled Anode exceed 200 microns in size. Characterizing heterogeneous lithiation areas is crucial, as they may lead to metallic lithium plating or other failure mechanisms.
Assessing the distribution of lithium within electrodes is vital for understanding lithium-ion behavior during charge and discharge cycles, as well as for characterizing the solid electrolyte interphase (SEI) layers.
Ultimately, comprehending lithium distribution is essential for optimizing battery performance, capacity, and lifespan.
Lithium Depth Profiling
To examine elemental distributions with depth, the Massbox generates depth profiles using either single laser spots or full 3D elemental maps. Figure 5 presents single-spot depth profiles collected from the three silicon anodes, using a 75-micron laser spot. The rate at which material is removed depends on both the material type and the user-defined laser power.
Figure 6 shows the depth profile of copper on the pristine anode. Around 49 seconds into the dwell, the copper signal rises sharply, indicating that the laser had fully penetrated the silicon layer and reached the underlying copper current collector.
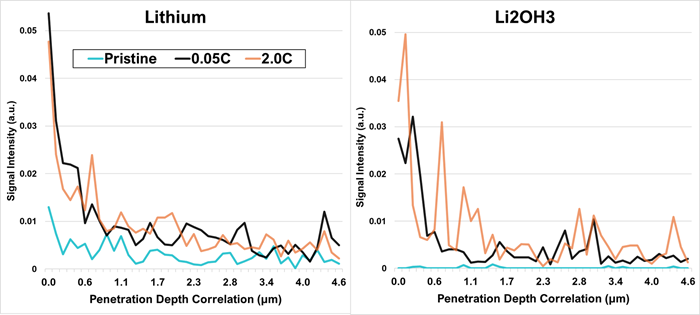
Figure 5. Depth profiles of lithium and a lithium species created using a 75-micron laser spot dwell on the three silicon anodes. Data points are the average of five laser spots, showing the signal intensity per second of dwelling and removing material. The amount of material removed per second was calibrated by measuring the laser spot’s penetration depth with a microscope. Image Credit: Exum Instruments
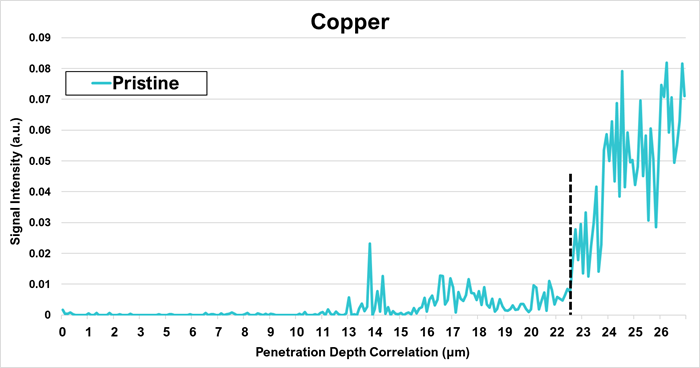
Figure 6. Depth profile of copper created using a 75-micron laser spot dwell on the Pristine Anode. Data points are the average of five laser spots, showing the signal intensity per second of dwelling and removing material. The amount of material removed per second was calibrated by measuring the laser spot’s penetration depth with a microscope. The dotted horizontal line indicates where the laser penetrated the silicon anode and struck the copper current collector. Image Credit: Exum Instruments
A microscope measurement of the spot dwell crater showed that the laser removed approximately 0.455 microns of material per second, providing a basis for depth correlation. As seen in Figure 6, the sharp increase in copper, corresponding to the anode’s current collector, occurred at a depth of about 22 microns. This aligns with the expected anode thickness of roughly 20 microns, validating the depth calibration.
In both cycled anodes, the mass spectra showed relatively high concentrations of elemental lithium as well as lithium species likely formed from electrolyte decomposition (e.g., Li2OH3).
Massbox’s LALI technique is designed to break down materials to their elemental components, but in complex matrices such as cycled battery electrodes, high-intensity lithium species often appear in the mass spectra.
Analyzing both elemental lithium and lithium compounds provides valuable insight into the origin and behavior of lithium in the sample. In electrodes that have undergone formation cycling, lithium species give an understanding of the solid electrolyte interface (SEI) layer.
As shown in Figure 5, concentrations of both elemental lithium and lithium species were highest at the surfaces of the cycled anodes and dropped to less than 20 % of their peak values within just one micron below the surface.
Comparing the lithium content in the cycled anodes to that of the pristine anode helps determine the amount of nonrecoverable lithium following a charge-discharge cycle.
Conclusions
Traditionally, lithium is a difficult element to measure and quantify reliably using conventional techniques. Addressing these challenges, Massbox offers a valuable solution for mapping, depth profiling, and quantifying lithium in battery materials.
Its innovative LALI technique enables detection of lithium at trace levels, down to hundreds of parts per billion. By simultaneously mapping lithium alongside other elements across the periodic table, users can determine whether high lithium concentrations are linked to metallic lithium (plating), electrolyte decomposition, or formation of the SEI layer.
In this study, Massbox identified areas of high lithium accumulation on the surface layers of cycled anodes. Depth profiles then revealed the vertical distribution of lithium and lithium species, likely tied to electrolyte breakdown.
These insights are critical for optimizing new electrode materials, such as silicon, and for understanding failure mechanisms.
Massbox enhances users’ understanding of lithium behavior within battery electrodes, supporting significant improvements in battery design and lifecycle management.
Its compact footprint, simplified operation, and intuitive software make advanced analysis more accessible. Operating under vacuum and equipped with an air-free transfer system, Massbox also prevents atmospheric exposure of lithium and other reactive materials, preserving sample integrity for accurate analysis.
By reducing the time required to characterize lithium in electrodes, Massbox helps accelerate research and product development. In addition to the capabilities shown here, it also supports quantitative analysis and rapid screening for quality control and assurance.

Image Credit: Exum Instruments

This information has been sourced, reviewed and adapted from materials provided by Exum Instruments.
For more information on this source, please visit Exum Instruments.