LIFT, operated by the American Lightweight Materials Manufacturing Innovation Institute, is a Detroit-based public-private partnership between the Department of Defense, industry, and academia. Its mission centers on advancing manufacturing technologies and implementing workforce development initiatives to equip today’s and tomorrow’s skilled labor force.
Through its broad ecosystem, LIFT helps accelerate innovations into the hands of both industry and the warfighter. Whether it’s saving lives on the battlefield or reducing costs and lead times for the Department of Defense and manufacturers, LIFT continues to push the boundaries of American advanced manufacturing.
Recent projects have had a real-world impact, for instance, reducing fatal rollovers in Humvees by up to 74 %.
LIFT operates a 100,000-square-foot high-bay facility that houses an industrial metrology (MET) lab and supports the testing and implementation of more than $50 million in advanced manufacturing technologies. These state-of-the-art tools are available to LIFT’s 340+ members, many of whom wouldn’t otherwise have access to such resources.
By providing this shared space, LIFT enables members to run pilot projects and evaluate new processes before committing to their own capital investments.
Chemical Analysis Technology
To support its mission of designing, building, and testing new materials for future Department of Defense components and other industries, LIFT needed a reliable method for analyzing the chemical composition, properties, and performance of those materials.
While its world-class MET lab was already outfitted with technologies like scanning electron microscopy (SEM), energy-dispersive X-ray spectroscopy (EDS), and other tools for metallographic and microstructural analysis, one key question remained: What do we do about chemical analysis?
LIFT evaluated established options such as Inductively Coupled Plasma Optical Emission Spectroscopy (ICP-OES) and ICP Mass Spectrometry (ICP-MS). However, these techniques posed several challenges when applied to solid materials. They involve multiple pieces of equipment, complex operational protocols, limited elemental coverage, and high ongoing costs from gases and consumables.
Recognizing the need for a more efficient approach, LIFT began searching for innovative alternatives.
LIFT and the Massbox
LIFT’s CEO, Nigel Francis, first encountered Massbox at the Defense Manufacturing Conference (DMC), where he met Ellen Williams, Exum’s Executive Vice President of Business Development.
Recognizing a potential solution to LIFT’s chemical analysis challenge, Nigel quickly introduced Ellen to John Keogh, LIFT’s Director of Engineering, who was actively sourcing new equipment for their world-class facility.
That chance meeting not only answered LIFT’s pressing question about innovation in chemical analysis but also led to the purchase of a Massbox for their MET lab—and the beginning of a strong partnership.
Massbox delivers rapid chemical compositional analysis of virtually any solid material, from feedstock powders to fully formed parts. It is the first Laser Ablation Laser Ionization Time-of-Flight Mass Spectrometer (LALI-TOF-MS) capable of trace-level detection across nearly the entire periodic table.
Tackling the common challenges in solid-state analysis, Massbox enables quantitative chemical profiling of metallic, trace, and low-mass elements—such as carbon and oxygen—in a single session. This streamlines workflows by reducing the need for multiple lab tests, specialized personnel, and long turnaround times.
Figure 1 illustrates Massbox’s operating process.
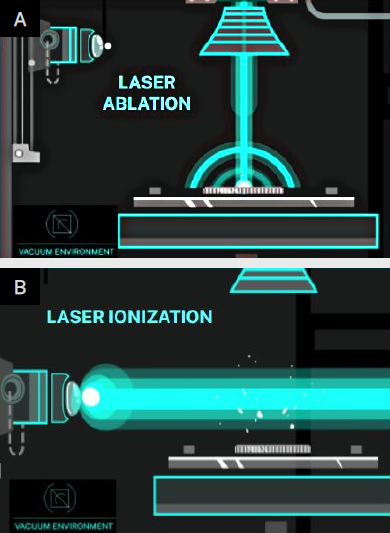
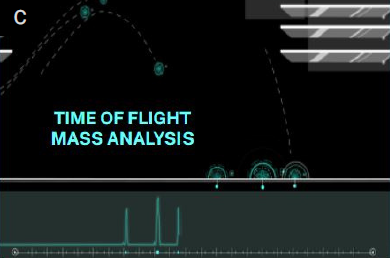
Figure 1. A) Ablation laser fires perpendicular to the sample's surface. The laser spot size is adjustable from 5-150 micron; B) Secondary laser performs multiphoton ionization of neutral particles created by ablation process; C) Ions are separated by Time-of- Flight mass spectrometry and detected with a multichannel plate (MCP). Image Credit: Exum Instruments
LIFT members, comprising original equipment manufacturers, material suppliers, and software providers from government, industry, and academia, have access to Massbox within its Detroit technology accelerator and pilot facility.
“As LIFT continues its focus on the intersection of materials, processing and systems engineering, this new tool is a game changer for LIFT and our broader ecosystem,” stated Noel Mack, Chief Technology Officer of LIFT.
“It is sure to serve as a vitally important resource in advancing high-tech research and development in Detroit and beyond.”
Determining Chemical Variations with Massbox
To demonstrate the capabilities of Massbox, LIFT conducted a thorough analysis of a 4041-alloy steel sample featuring a nickel weld.
Massbox enables both bulk analysis of a material's chemical composition and elemental mapping, with a spatial resolution ranging from 5 to 150 microns and the capability to analyze an area of up to 83 mm by 83 mm.
This study focused on evaluating the effectiveness of a nickel weld on a steel substrate.
Chemical Data at the Point of Need
Traditional high-performance techniques like ICP-OES and ICP-MS often rely on acid digestion to achieve accurate chemical analysis.
These sample preparation steps require a high level of expertise to execute correctly, especially when accounting for signal interferences and ensuring proper calibration. They also necessitate a clean lab environment and come with significant ongoing costs for acids and other consumables.
To address these challenges, Massbox offers trace-level detection across the full periodic table in a compact, desktop format. It operates on a standard power cable and features an intuitive interface that doesn’t require a background in chemistry.
Figure 2 shows where Massbox is installed within LIFT’s MET Lab.
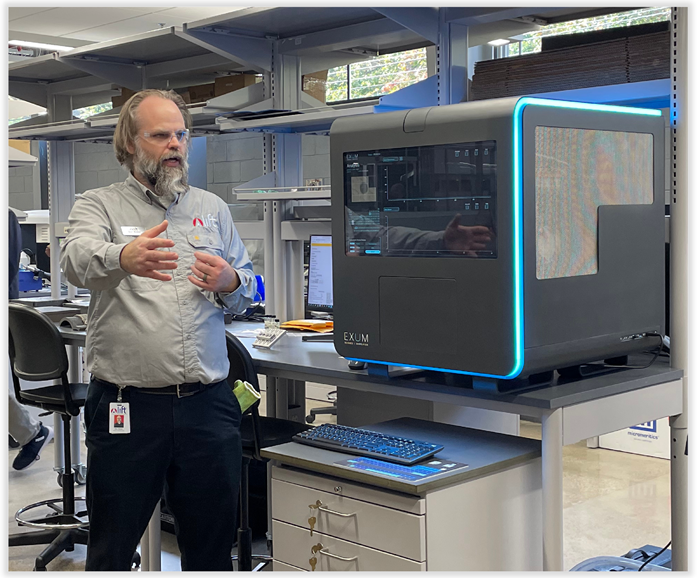
Figure 2. LIFT’s Senior Metallurgist, Daniel Baker, explains how Massbox operates as it analyzes a set of aluminum powder samples. Image Credit: Exum Instruments
Because Massbox analyzes solid materials directly, it eliminates the need for acid digestion, clean lab environments, or trained chemists. Its streamlined operation allows users at LIFT’s facility to quickly verify material quality or investigate component failures with ease.
Nickel Weld Analysis
The analytical process involved rastering a small area of 5.5 mm by 4.9 mm using a 75-micron laser spot size. The laser spot size can be adjusted based on the desired resolution.
For the study discussed in this article, the analyzed area included both the nickel weld and the steel substrate, as depicted in Figure 3.
LIFT performed two raster passes: the first captured chemical data from the sample’s surface, while the second revealed chemical variations beneath the ablated surface, allowing users to create depth profiles.
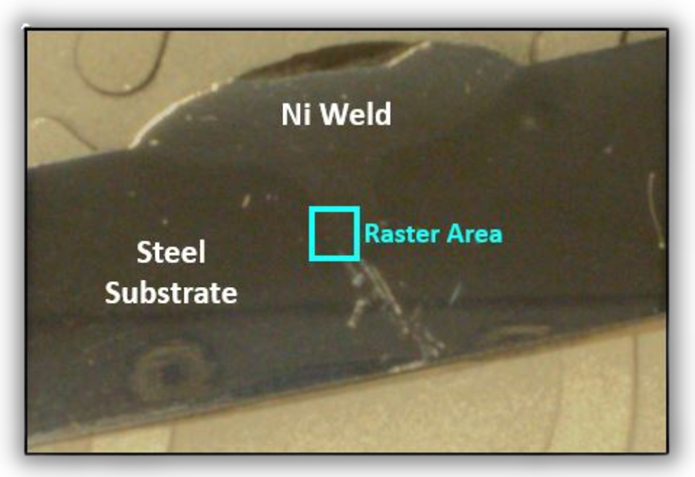
Figure 3. Image of the welded sample taken by Massbox’s macrocamera. The blue rectangle shows the raster area of analysis. Image Credit: Exum Instruments
Results
Massbox generated chemical maps illustrating the spatial distributions of specific elements of interest.
Figure 4 presents maps for nickel (Ni), iron (Fe), chromium (Cr), titanium (Ti), and aluminum (Al), with results extending beyond the elements displayed here. Each pixel corresponds to a 75-micron laser spot and encompasses a complete mass spectrum of data.
The color scale indicates relative concentrations, with lighter blues representing higher concentrations. Notably, the high concentration of Ni (light blue) in the top right corner corresponds to the welded area.
As anticipated, Ni concentration is elevated in the weld and diminished (dark blue) on the steel substrate. The weld boundary appears as a narrow gradient, spanning only a few pixels (approximately 200 microns).
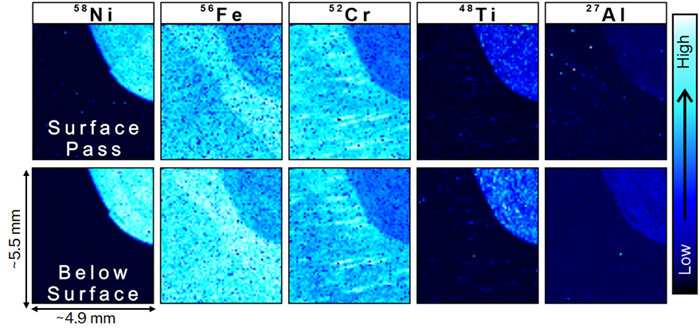
Figure 4. Mapping results acquired by Massbox on a welded sample. The analysis area is 4.9 mm by 5.5 mm with a 75-micron laser spot size. The color scale shows relative concentration of each element with lighter colors indicating higher concentrations. The top row shows results from the first pass on the sample’s surface and the bottom row is from the repeat pass, below the ablated surface. Image Credit: Exum Instruments
The top row illustrates results from the sample's surface, while the bottom row showcases data from the repeat pass below the surface.
The Fe map displayed a more pronounced contrast below the surface, despite Fe being the predominant element in steel. This lack of contrast suggests dilution of the base steel into the Ni weld area in the top right corner of the map. Concentrations appeared relatively uniform across the weld and substrate in the surface map.
Distributions of Cr and trace elements, Ti and Al, also exhibited variations from the surface to the repeat pass. Repeat passes enable users to construct depth profiles for any element of interest.
The volume of material removed during each raster is contingent on user-defined laser power and material type. For most metals, each ablated layer removes 100s of nm, facilitating high-resolution depth analyses.
Conclusions
The comprehensive nickel weld analysis highlights Massbox's capabilities in mapping and depth profiling.
The study discussed here enabled LIFT to characterize the nickel weld gradient and the dilution of substrate material within the weld. By comparing results from the surface to the repeat pass, surface contaminants were effectively excluded, revealing changes in certain elements with depth.
The depth profiling capabilities of the Massbox are also advantageous for the analysis of coatings, surface finishes, oxide layers, and other complex materials.
In addition to the transition metals depicted in Figure 4, the results included light elements such as carbon, as well as heavier elements like molybdenum and niobium. Traditional instruments often fall short in quantitatively measuring both light and heavy elements in a single analytical session.
This analysis highlights Massbox’s contribution to advancing materials research and development, reinforcing its value in the field of advanced manufacturing. Rather than investing in a full clean lab and taking on the operational costs of traditional techniques, LIFT chose a more innovative path for chemical analysis.
With Massbox now integrated into their MET Lab, LIFT can access critical chemical data precisely when and where it’s needed.

This information has been sourced, reviewed and adapted from materials provided by Exum Instruments.
For more information on this source, please visit Exum Instruments.