Polycyclic aromatic hydrocarbons (PAHs) and polychlorinated biphenyls (PCBs) are among the most hazardous and persistent organic pollutants found in contaminated soils.
Large quantities of PCBs were produced between the 1930s and 1980s. They were primarily employed in coolant fluids and electrical devices until environmental concerns prompted an international agreement banning the use of the majority of PCBs in 1986.1
The incomplete combustion of organic materials is the primary cause of PAHs’ formation and release into the environment. This can result from food preparation, natural grassland and forest fires, and volcanic activities.
The formation of PCBs involves the attachment of one or more chlorine atoms to a pair of connected benzene rings (Figure 1).2 There are 209 different PCBs, depending on the position and number of the chlorine atoms attached to the biphenyl structure.
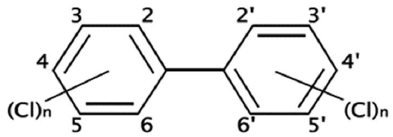
Figure 1. Polychlorinated Biphenyl chemical structure. Image Credit: SCION Instruments UK Ltd
PAHs are comprised of two or more fused aromatic benzene rings (Figure 2). These rings are hydrophobic, non-polar, and chemically stable.
The aromatic structure of these compounds makes them relatively stable, while their toxicity stems from chemical and physical characteristics, such as high melting and boiling points and low vapor pressure.2
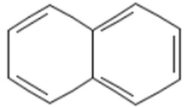
Figure 2. Naphthalene chemical structure. Image Credit: SCION Instruments UK Ltd
PCBs and PAHs can travel through water, soil, and air, persisting in the environment for extended periods. They are also linked to a number of health issues, including skin problems, liver damage, and potential carcinogenic effects on both humans and animals.1
The popular and efficient sample preparation technique known as QuEChERS (standing for quick, easy, cheap, effective, rugged, and safe) is well-suited to the analysis of trace contaminants in soil samples, particularly PCBs and PAHs.
QuEChERS leverages a solvent extraction combined with dispersive solid-phase extraction (d-SPE) cleanup. This method reduces sample preparation time, solvent consumption, and costs, making it an appealing alternative to Soxhlet, ultrasonic extraction, and other traditional techniques.
Before being suitable for injection onto the gas chromatograph (GC) for analysis, it is important that a soil sample undergoes an appropriate sample preparation technique. Figure 3 shows how the soil sample appears before and after the application of the QuEChERS method.
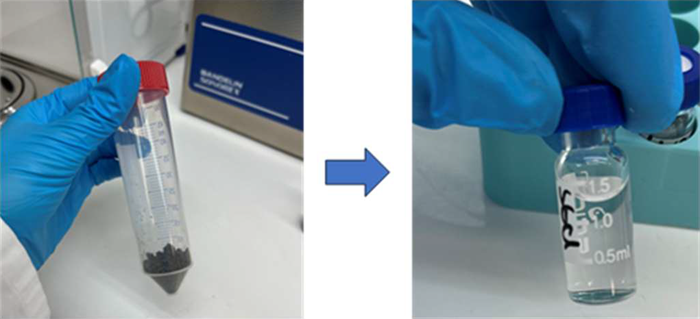
Figure 3. From soil sample to clear sample, suitable for GC analysis. Image Credit: SCION Instruments UK Ltd
Concerns about health effects and environmental impacts have prompted a range of countries to introduce regulations controlling the use of PCBs and PAHs. While these regulations differ between countries, all seek to prevent and minimize their release, protect people from adverse effects, and help ensure cleaner ecosystems. They are primarily implemented to accelerate PCB and PAH removal, placing strict controls on their storage, use, and disposal.
It is important to test for PCBs and PAHs to better prevent environmental leakage and to ensure compliance with disposal and cleaning regulations. Regular testing and monitoring provide essential information on PCB and PAH levels in water, soil, and air, allowing appropriate actions to be taken to control contamination.
The application outlined here can be performed using either the SCION Instruments 8300 GC or 8500 GC platform (Figure 4), in combination with an 8700 MS (SQ) and the SCION 8400PRO Autosampler. An SCION-5MS column is used to ensure optimal PCB and PAH compound separation.
MS is employed in target compound identification. The integrated NIST library search tool was used in this instance, but additional libraries are available for purchase.
Experimental
A PCB/PAH standard and an internal standard (Table 2) were purchased to enable qualification and quantification of unknown samples. The standard included 29 different PCB and PAH compounds at a concentration of 500 μg/mL.
The internal standard contained two compounds at a concentration of 1000 μg/mL: Tetrachloro-m-xylene (TCMX) and decachlorobiphenyl (deca-CB).
Table 1. Instrumentation operating conditions for GC and MS (SQ). Source: SCION Instruments UK Ltd
| GC Part |
Settings |
| Injector |
240 °C
Split program, initial: 50:1, 0.01 minutes: off, 0.50 minutes: 50:1
Pressure pulse: 25 psi, 0.4 minutes |
| Injection Volume |
1 μL |
| Column |
SCION-5MS
30 m x 0.25 mm x 0.25 μm |
| Carrier Gas |
Helium 1 mL/minute |
| Oven Program |
50 °C (hold 2 minutes),
8 °C/minute to 325 °C (hold 3.63 minutes) |
| Run Time |
40 minutes |
| Software |
MSWS |
| MS Part |
Settings |
| MS transfer line temp |
275 °C |
| Ion source temp |
300 °C |
| MS mode |
Electron Ionization |
| Delay collection time |
8 minutes |
| Scan mode |
SIM mode |
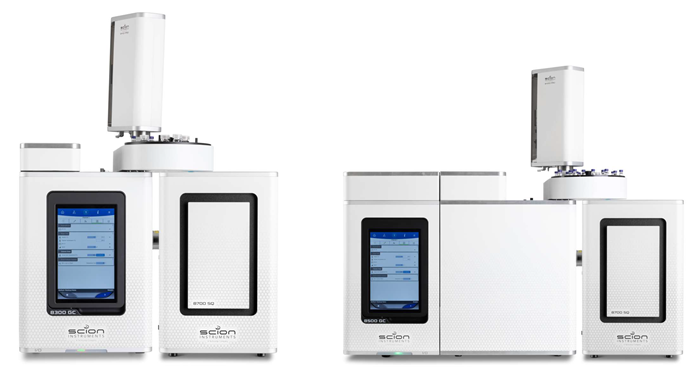
Figure 4. SCION Instruments 8300 & 8500-GC and 8700 MS and 8400PRO Autosampler. Image Credit: SCION Instruments UK Ltd
Sample Preparation
Linearity samples were prepared in n-Hexane at nine different levels. These included concentrations from 10 ppb to 400 ppb.
System precision was determined using multiple L4 injections at 60 ppb (n=9). TCMX and Deca-CB (50 ppb) were used as internal standards (IS) in all samples and standards.
Table 2. Compounds and CAS numbers of the PCB/PAH standard and internal standard. Source: SCION Instruments UK Ltd
| No. |
PCB no. |
Compound |
CAS Number |
| 1 |
- |
Isophorone |
78-59-1 |
| 2 |
- |
Acenaphthylene |
38444-84-7 |
| 3 |
PCB-1 |
2-Chlorobiphenyl |
2051-60-7 |
| 4 |
PCB-3 |
4-Chlorobiphenyl |
2051-62-9 |
| 5 |
- |
Fluorene |
86-73-7 |
| 6 |
- |
TCMX (IS) |
877-09-8 |
| 7 |
PCB-7 |
2,4'-Dichlorobiphenyl |
34883-43-7 |
| 8 |
- |
Hexachlorobenzene |
118-74-1 |
| 9 |
PCB-18 |
2,2',5-Trichlorobiphenyl |
37680-65-2 |
| 10 |
- |
Phenanthrene |
85-01-8 |
| 11 |
- |
Anthracene |
120-12-7 |
| 12 |
PCB-28 |
2,4,4'-Trichlorobiphenyl |
7012-37-5 |
| 13 |
PCB-52 |
2,2',5,5'-Tetrachlorobiphenyl |
35693-99-3 |
| 14 |
PCB-44 |
2,2',3,5'-Tetrachlorobiphenyl |
41464-39-5 |
| 15 |
PCB-61 |
2,3',4',5-Tetrachlorobiphenyl |
32598-11-1 |
| 16 |
- |
Pyrene |
129-00-0 |
| 17 |
PCB-109 |
2,3,3',4',6-Pentachlorobiphenyl |
38380-03-9 |
| 18 |
PCB-142 |
2,2',3,4',5',6-Hexachlorobiphenyl |
38380-04-0 |
| 19 |
PCB-114 |
2,3',4,4',5-Pentachlorobiphenyl |
31508-00-6 |
| 20 |
PCB-153 |
2,2',4,4',5,5'-Hexachlorobiphenyl |
35065-27-1 |
| 21 |
PCB-137 |
2,2',3,4,4',5'-Hexachlorobiphenyl |
35065-28-2 |
| 22 |
- |
Benz(a)anthracene |
56-55-3 |
| 23 |
- |
Chrysene |
218-01-9 |
| 24 |
PCB-180 |
2,2',3,4,4',5,5'-Heptachlorobiphenyl |
35065-29-3 |
| 25 |
- |
Benzo(b)fluoranthene |
205-99-2 |
| 26 |
- |
Benzo(k)fluoranthene |
207-08-9 |
| 27 |
- |
Decachlorobiphenyl (IS) |
2051-24-3 |
| 28 |
- |
Benzo[a]pyrene |
50-32-8 |
| 29 |
- |
Indeno(1,2,3-cd)pyrene |
193-39-5 |
| 30 |
- |
Dibenz(a,h)anthracene |
53-70-3 |
| 31 |
- |
Benzo(g,h,i)perylene |
191-24-2 |
The original QuEChERS (unbuffered) method was used in this application.3
The samples were prepared by weighing five grams of soil in a 50 mL tube, before adding 15 mL of acetonitrile/water (75%:25%, v/v). This mixture was then vortexed for four minutes before being sonicated for a further 20 minutes.
Extraction salts were added and vortexed for an additional four minutes, then centrifuged for 10 minutes at 4500 rpm.
Six mL of supernatant was transferred to a 15 mL tube with cleanup salts: 150 mg primary secondary amine (PSA), 900 mg MgSO4, and 150 mg Octadecylsilane (C18).
The cleanup tube was vortexed for four minutes and then centrifuged for 10 minutes at 4500 rpm. Next, 1.5 mL of the upper layer was directly filtered into the vial before being injected into the GC.
Six QC samples were spiked with the PCB/PAH standard, and an IS was added to determine recovery. Three QC blank samples also had IS added only prior to sample preparation via QuEChERS.
Results were then compiled, with recovery calculated using the QC-spiked and QC blank samples.
Nine soil samples were prepared to determine whether PCBs and PAHs were present. These nine samples had only IS added prior to QuEChERS sample preparation. Two compounds were present in the IS; Table 3 shows which IS was used for each compound, along with the quantifier and qualifier ions employed.
Results
Not all compounds are discussed in this section due to the number of compounds present in this standard.
Calibration curves for the PCB/PAH standards were prepared at nine different levels ranging from 10 to 400 ppb. Nine consecutive injections of PCB/PAH standard (#4) (60 ppb) were used to determine the method’s system precision.
Table 4 shows precision results for the selected PCB/PAH compounds, as well as linearity (R2) values obtained from the calibration curves. An R2 of 0.993 or higher was achieved for all PCB/PAH components. Many regulations require an R2 value of ≥0.99, indicating an excellent result.
Repeatability results confirm relative standard deviations (RSD%) below 6% for the PCB/PAH compounds. This result represents good precision for the method, because the majority of acceptance criteria for PCB/PAH method validation stipulate an RSD ≤15%.3
Table 3. Quantifier and qualifier ions used, IS used and scan time. Source: SCION Instruments UK Ltd
| No. |
Quantifier Ion and Qualifier ions |
IS used |
| 1 |
54/82/138 |
TCMX |
| 2 |
151/152/153 |
TCMX |
| 3 |
152/153/188 |
TCMX |
| 4 |
152/188/190 |
TCMX |
| 5 |
165/166/167 |
TCMX |
| 6 |
207/209/244 |
- |
| 7 |
142/284/286 |
TCMX |
| 8 |
152/222/224 |
TCMX |
| 9 |
186/256/258 |
TCMX |
| 10 |
152/176/178 |
TCMX |
| 11 |
176/178/179 |
TCMX |
| 12 |
186/256/258 |
TCMX |
| 13 |
220/290/292 |
TCMX |
| 14 |
220/290/292 |
TCMX |
| 15 |
220/290/292 |
TCMX |
| 16 |
200/202/203 |
Decachlorobiphenyl |
| 17 |
324/326/328 |
Decachlorobiphenyl |
| 18 |
290/360/362 |
Decachlorobiphenyl |
| 19 |
324/326/328 |
Decachlorobiphenyl |
| 20 |
145/360/362 |
Decachlorobiphenyl |
| 21 |
290/360/362 |
Decachlorobiphenyl |
| 22 |
226/228/229 |
Decachlorobiphenyl |
| 23 |
226/228/229 |
Decachlorobiphenyl |
| 24 |
324/394/396 |
Decachlorobiphenyl |
| 25 |
250/252/253 |
Decachlorobiphenyl |
| 26 |
250/252/253 |
Decachlorobiphenyl |
| 27 |
178/214/498 |
- |
| 28 |
250/252/253 |
Decachlorobiphenyl |
| 29 |
138/276/274 |
Decachlorobiphenyl |
| 30 |
139/276/278 |
Decachlorobiphenyl |
| 31 |
138/274/276 |
Decachlorobiphenyl |
Table 4. Summary of results: linearity and repeatability. Source: SCION Instruments UK Ltd
| No. |
Compound |
R2 |
Repeatability (%RSD) |
| 3 |
2-Chlorobiphenyl |
0.9974 |
4.39 |
| 5 |
Fluorene |
0.9976 |
4.93 |
| 16 |
Pyrene |
0.9993 |
2.38 |
| 21 |
2,2',3,4,4',5'-Hexachlorobiphenyl |
0.9984 |
1.86 |
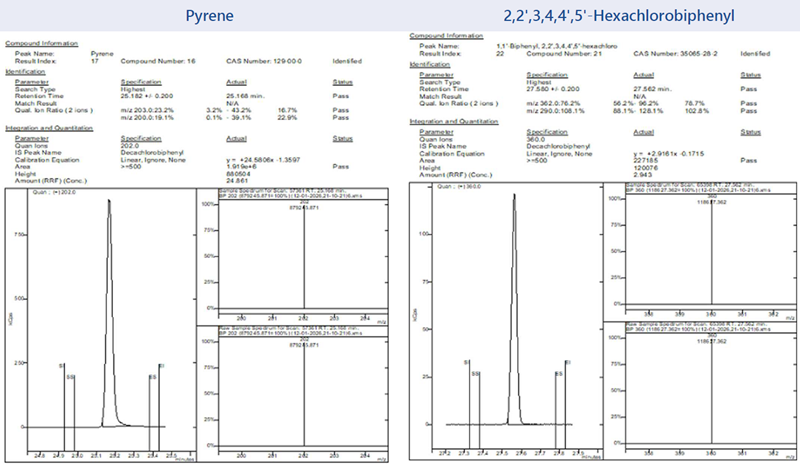
Figure 5. Example compounds chromatograms with corresponding spectra. Image Credit: SCION Instruments UK Ltd
Figure 5 shows an example chromatogram from the MSWS software, which displays the peaks for Pyrene and 2,2',3,4,4',5'-Hexachlorobiphenyl, along with their corresponding mass spectra.
Figure 6 shows the TIC from an SIM run, highlighting good separation between the PCB/PAH and IS compounds.
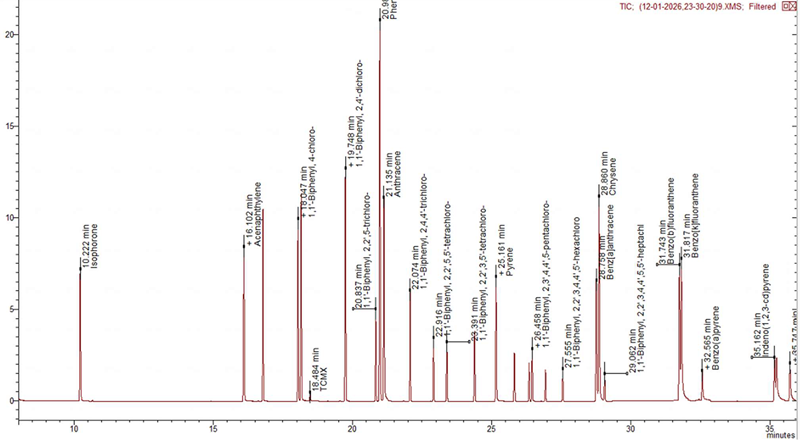
Figure 6. Total Ion Chromatogram (TIC). Image Credit: SCION Instruments UK Ltd
Table 5. Summary of results – recovery. Source: SCION Instruments UK Ltd
| No. |
Compound |
Recovery (%) |
RSD (%) |
| 5 |
Fluorene |
109.79 |
4.93 |
| 9 |
2,2',5-Trichlorobiphenyl |
132.78 |
5.68 |
| 16 |
Pyrene |
122.60 |
2.38 |
| 19 |
2,3',4,4',5-Pentachlorobiphenyl |
97.74 |
1.90 |
| 31 |
Benzo(g,h,i)perylene |
130.84 |
3.16 |
Recovery percentages (Table 5) for the spiked QC samples ranged from 58% to 150%, with repeatability (RSD) values between 1% and 9.72%. These results confirm good method reliability and efficiency.
The soil samples were found to contain no PCB compounds, but a number of PAH compounds were detected in the samples with concentrations between 6 and 202 ppb (Table 6).
Samples originated from the same soil source, with RSD determined to be between 1.97% and 13.63%. These results further highlight the method’s robustness.
Table 6. Summary of results – PAHs found. Source: SCION Instruments UK Ltd
| No. |
Compound |
Soil sample (ppb) |
RSD (%) |
| 2 |
Acenaphthylene |
6.12 |
13.63 |
| 5 |
Fluorene |
10.49 |
7.97 |
| 10 |
Phenanthrene |
63.86 |
3.13 |
| 11 |
Anthracene |
24.44 |
2.87 |
| 16 |
Pyrene |
127.07 |
2.30 |
| 22 |
Benz(a)anthracene |
144.59 |
1.94 |
| 23 |
Chrysene |
133.16 |
3.77 |
| 25 |
Benzo(b)fluoranthene |
201.78 |
2.00 |
| 26 |
Benzo(k)fluoranthene |
87.71 |
3.04 |
| 28 |
Benzo[a]pyrene |
173.96 |
1.97 |
| 29 |
Indeno(1,2,3-cd)pyrene |
134.28 |
8.64 |
| 30 |
Dibenz(a,h)anthracene |
43.60 |
3.00 |
| 31 |
Benzo(g,h,i)perylene |
99.10 |
3.63 |
Figure 7 compares the 100 ppb standard (red) with the soil sample (green). The soil sample showed a clear peak for Pyrene, while the two peaks beside Pyrene represent PCBs not found in the soil sample.
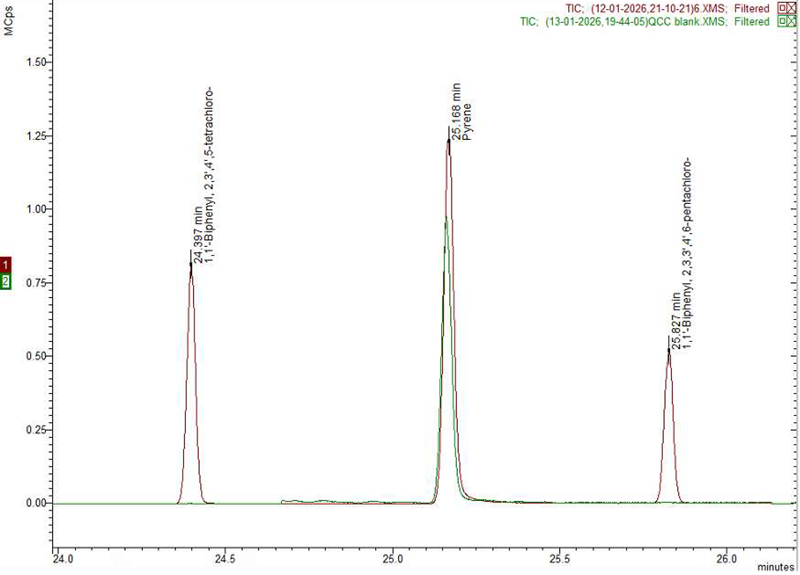
Figure 7. 100 ppb std (red) vs soil sample (green). Image Credit: SCION Instruments UK Ltd
Method Validation
All samples were analyzed within a single sample sequence to ensure thorough validation of the method. The run commenced with three solvent blanks to confirm that the system was uncontaminated, followed by linearity samples and system precision (repeatability) samples.
Three QC blanks and six QC samples were analyzed next, followed by the soil samples. This was bracketed by two additional QC samples to ensure consistent system performance and to confirm the reliability of all previously analyzed samples.
A solvent blank was injected last to confirm there was no carry-over.
Conclusion
The application presented here used a SCION 8500 GC platform fitted with a split/splitless injector, along with an SCION-5MS column and the 8700 MS and 8400PRO samplers.
This setup is an ideal solution for the qualitative and quantitative analysis of PCBs and PAHs in soil.
This application was shown to achieve good linearity, system precision, and recovery. It was possible to achieve an LOQ of 10 ppb and recover a 50 ppb spiked sample, confirming the method's good performance.
The original QuEChERS method (unbuffered) was used to prepare soil samples for GC analysis, and results were acquired using a combination of the SCION Instruments GC-MS setup and the MSWS software. The SCION-5MS column demonstrated good separation between the PCB and PAH compounds.
Multiple results obtained with this application suggest that the analyzed soil samples are most likely from soil that has been exposed to PAHs but not PCBs.
This method can also be performed using the SCION Instruments 8300/8500 GC-platform with Electron Capture Detector (GC-ECD). This instrument has been developed for PCBs in soil only.
References and Further Reading
- Europian Commission (2023). PCBs/PCTs. Available at: https://environment.ec.europa.eu/topics/waste-and-recycling/pcbspcts_en.
- Montano, L., et al. (2025). Polycyclic Aromatic Hydrocarbons (PAHs) in the Environment: Occupational Exposure, Health Risks and Fertility Implications. Toxics, 13(3), p.151. DOI:10.3390/toxics13030151. https://www.mdpi.com/2305-6304/13/3/151.
- Samia Alsefri, et al. (2023). Development of the QuEChERS Extraction Method for the Determination of Polychlorinated Biphenyls (Aroclor 1254) in Soil Samples by Using GC-MS. Separations, 10(4), pp.250–250. DOI:10.3390/separations10040250. https://www.mdpi.com/2297-8739/10/4/250.

This information has been sourced, reviewed, and adapted from materials provided by SCION Instruments UK Ltd.
For more information on this source, please visit SCION Instruments UK Ltd.