Few people today would dispute that the use of Mie Theory provides the only route to accurate particle size analysis when measuring fine particles using laser diffraction. The international standard for laser diffraction specifies that “for particles smaller than about 50 microns the Mie Theory offers the best general solution”. However, this can often be a difficult requirement to meet, as Mie Theory requires users to specify the refractive index (RI) of the material under study.
If the user is measuring inorganic compounds there is ample data available in standard texts such as the CRC Handbook or on the Internet. Pharmaceutical materials present more of a problem, as it is extremely unlikely that the RI for a new active pharmaceutical ingredient (API) will be known. In such situations the temptation is to default to using the Fraunhofer Approximation which, although wrong, is considered to be better than “guessing” a RI value. However, this can lead to large errors in the assessment of the fine particle fraction, a parameter vital in assessing the solubility and therefore bioavailability of a given API.
Determination of Refractive Index Using Liquid Measurements.
Liquid measurements can be easily and rapidly achieved using an Abbe Refractometer, providing RI values to an accuracy of 4 decimal places. This is well beyond the accuracy required for laser diffraction, where specification to 2 decimal places is generally considered to be enough to achieve accurate results.
Powder Refractive Index Measurements
RI determination for powdered materials is more complicated. Traditional methods rely on the formation of single crystals or on complex microscope observations. This is often seen to be an unrealistic requirement within laboratories handling a variety of unknown APIs. However, it is possible to calculate the RI of APIs in less than 30 minutes using simple refractometer measurements. This procedure is outlined here.
Saveyn et al proved that the bulk RI of water-dispersible granules could be measured by determining the RI of solutions formed by dissolving the granules in an appropriate solvent. The RI recorded for known solute concentrations could be extrapolated to 100% concentration in order to calculate the bulk RI.
Their work included examples of materials dissolved in a range of different solvents. In each case it was assumed that the solutions behaved ideally i.e. no strong solvent-solute or solute-solute interactions occurred. This assumption is generally valid for solute concentrations of less than 1wt%, where the RI varies linearly with concentration. It was also ensured that the material under test was not disassociated by the solvent.
The above assumptions are often valid for APIs. Most are soluble in water and show a linear change in RI with concentration at low concentrations. The method described by Saveyn et al therefore provides a rapid and reliable way of determine the RI values required for accurate particle size analysis. Examples of how this is achieved are given below.
Experimental
The RIs of two generic APIs (Lisinopril and Enalapril Maleate) were determined using Saveyn’s method. Solutions of these APIs were created in deionised water over a range of concentrations from 0.1wt% to 1wt%. The RI of the resultant solutions was measured using an Abbe Refractometer and extrapolated to 100% concentration to yield the solid RI.
Validation of the values obtained using Saveyn’s method was carried out using the standard Becke Line microscopy test.
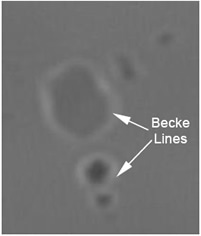
This relies on observing the position of the interference band seen close to the interface between a particle and the liquid it is suspended in (figure 1). This interference band always appears in the phase with the highest RI. Observations were made of the API particles suspended in a series of index matching oils of different RIs. This allowed the liquid RI where the interference band moved from within the liquid to within the particle to be determined. This provided an accurate independent measure of the particle RI.
|
|
|
Figure 1. Microscope picture showing the Becke Line present in the liquid phase (Liquid RI > Particle RI).
|
Results for Lisinopril
The RIs of Lisinopril solutions over a range from 0.1wt% to 1wt% are reported in figure 2. As can be seen, there is a linear dependence of refractive index with concentration within the region studied. By using the equation of the best-fit line (which has a 99% confidence interval) the RI at 100% concentration can be calculated. This yields an RI of 1.54 for Lisinopril.
|
|
|
Figure 2. Lisinopril solution RIs.
|
The RI predicted above was used as the starting point for a Becke Line study. The appearance of the Becke Line was observed over a range of oil RIs from 1.50 to 1.60. From this it was determined that the actual RI of Lisinopril was between 1.57 and 1.58.
Figure 3 shows the particle size distributions calculated by laser diffraction (Mastersizer 3000) using Mie Theory for RI values of 1.54 and 1.575. The result obtained using the Fraunhofer Approximation is also shown. As can be seen, the RIs predicted from the refractometer measurements and the Becke Line study yield virtually the same results. However, the Fraunhofer Approximation reports a higher fine particle fraction, as evidenced by the shift in the calculated Dv10 and Dv50 values (table 1). This shows the importance of using Mie Theory.
|
|
|
Figure 3. Comparison of Lisinopril size distributions calculated using RIs of 1.575, 1.54 and the Fraunhofer Approximation.
|
Table 1. Distribution statistics for Lisinopril.
|
|
|
RI = 1.54
|
1.77
|
4.10
|
13.46
|
|
RI = 1.575
|
1.85
|
4.28
|
13.83
|
|
Fraunhofer Approximation
|
1.26
|
3.17
|
10.11
|
Results for Enalapril Maleate
The RIs of solutions of Enalapril Maleate are reported in figure 4 over a concentration range from 0.1wt% to 1wt%. As with Lisinopril, there is a linear dependence of RI with concentration within the region studied. Extrapolation to 100% concentration yields an RI of 1.54. The Becke Line test provides an RI of between 1.55 and 1.56.
|
|
|
Figure 4. Enalapril Maleate solution RIs.
|
The Mastersizer 3000 laser diffraction results obtained using Mie Theory with RI values of 1.54 and 1.555 are shown in figure 5 along with that reported using the Fraunhofer approximation. Again, the difference in the results obtained using each of the RI values is negligible. However, the fine fraction is massively over-reported when using the Fraunhofer model, causing a significant reduction in the reported Dv10 (table 2).
|
|
|
Figure 5. Comparison of Enalapril Maleate size distributions calculated using RIs of 1.55, 1.54 and the Fraunhofer Approximation.
|
Table 2. Distribution statistics for Enalapril Maleate.
|
|
|
RI = 1.54
|
3.96
|
10.17
|
26.22
|
|
RI = 1.555
|
4.02
|
10.23
|
26.30
|
|
Fraunhofer Approximation
|
2.56
|
8.73
|
25.68
|
Conclusion
The use of Mie Theory is vital when using laser diffraction (Mastersizer 3000) if accurate fine particle measurements are to be made. However, the requirement for accurate RI values when using Mie Theory often forces users to select the Fraunhofer Approximation instead.
As shown here, simple refractometer measurements provide a rapid, reliable method of calculating the RI of compounds such as pharmaceutical actives to an accuracy that is sufficient for laser diffraction result calculations. As such, there is no need to rely on the Fraunhofer Approximation, allowing users to avoid the errors associated with its use.
.png)
This information has been sourced, reviewed and adapted from materials provided by Malvern Panalytical.
For more information on this source, please visit Malvern Panalytical.