The research and development of photovoltaic devices focuses primarily on increasing the conversion efficiency or improving the production process of solar cells. Gaining insights into the micro- and nanostructures as well as the chemical properties is crucial to achieve further improvements.
For these studies, Confocal Raman Imaging is a valuable tool as it not only provides optical information but also data pertaining to the 3D distribution of the crystallinity, chemical compounds and material stress. This article discusses the use of Confocal Raman Imaging to analyze stress fields around laser-drilled holes on a Si solar cell and to study concentration-dependent properties of a dye solar cell.
Stress Fields Around a Laser-drilled Hole on a Si Solar Cell
Figure 1 shows the typical configuration of Si-based solar cells. The contacts for discharging are usually placed on top of the p- and n-doped material. However, at this position, the contacts block some amount of the sunlight, which, in turn, decreases the efficiency. Hence, they are now placed on the bottom of the solar cells by drilling holes through the cells using laser. Nevertheless, the drilling process can trigger strain around the holes on the Si solar cell, causing a drop in the efficiency.
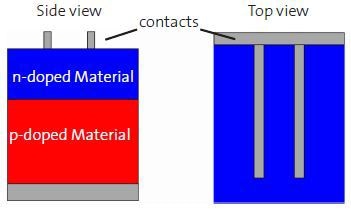
Figure 1. Typical set-up of a solar cell (sample courtesy of Fraunhofer-Institute for Solar Energy Systems ISE).
This article analyzes two approaches of lowering the stress:
1. Lowering the laser power for drilling using
- 20% drilling power with 20 repetitions
- 100% drilling power with 9 repetitions.
2. Etching the wafer after the drilling process:
- No etching
- One minute etching with KOH
- Two minutes etching with KOH
- Four minutes etching with KOH
- Six minutes etching with KOH.
Confocal Raman Imaging measurements were performed to assess the strain induced by the drilling process around the holes on the Si using a WITec alpha700 system equipped with a 532nm excitation laser and a 100x air objective (NA 0.9).
The scattered light was guided into a WITec UHTS 300 spectrometer utilizing a 50µm core diameter multi-mode fiber, which also serves as the pinhole for confocal detection. The spectrometer is coupled with an 1800 grooves/mm grating and a back-illuminated CCD camera. The integration time was 23ms/spectrum and 150x150 pixels (=22500 spectra) over an area of 35x35µm. The total acquisition time per image was below 10 minutes.
Some of the holes exhibited splashes of Si on the surface of the wafer, causing a higher first order Si peak on these structures as delineated in Figure 2, where the integrated intensity of the Si peak is calculated at each pixel and displayed as an image. Nevertheless, these areas were not taken for the strain measurements, but the holes with comparatively smooth looking surroundings were chosen (Figure 3).
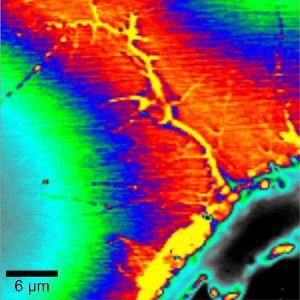
Figure 2. Splash of Si onto the surface out of the hole (bottom right). Plotted is the integrated intensity of the first order Si peak.
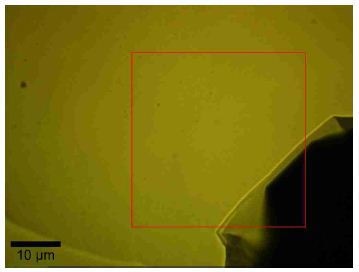
Figure 3. Video Image of a typical scan area (red box) on the Si. The hole is visible on the bottom right corner.
For each image, a Lorentzian curve was used to fit the first order Si peak to evaluate the exact peak position (Figure 4). From these images, cross sections were extracted and graphed as relative peak positions (in rel.1/cm) vs. distance (Figures 5 and 6).
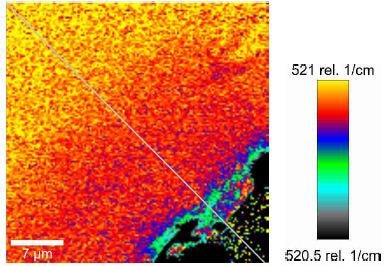
Figure 4. A typical stress map of the Si from the outside to the hole (bottom right). Along the indicated cross section (gray line), the radial change of the stress field was evaluated.
Figure 5 displays the results for the samples subjected to different etching processes and full drilling power, with different color codes: no etching (red); 1 minute etching (blue); 2 minutes etching (green); 4 minutes etching(black); and 6 minutes etching (magenta). Figure 6 delineates the results for the samples drilled with only power, but with the same color coding used in Figure 5.
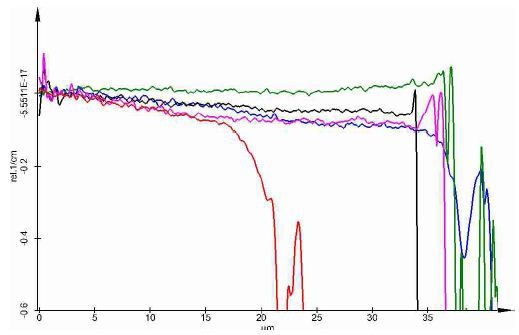
Figure 5. The cross sections of the various samples drilled with 100% laser power.
Figure 5 reveals that the sample without etching and the sample etched for only 1 minute exhibit a clear drop of the peak position prior to reaching the edge of the hole. However, other samples do not show this drop. Figure 6 also reveals the same information. Moreover, the graphs suggest that the soft drilling process minimizes the far reaching stress field, as represented by the slope of the lines. Both graphs suggest that the 2 minutes etching process is adequate.
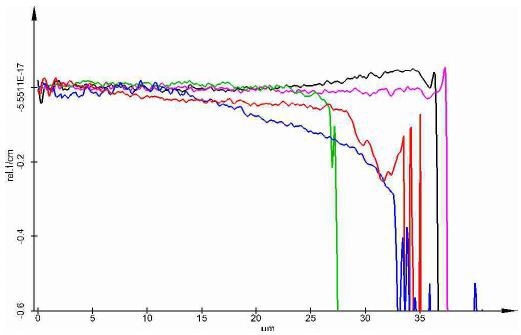
Figure 6. The cross sections of the various samples drilled with 20% laser power.
Analysis of Concentration-Dependent Properties of Dye Solar Cells
A test array was prepared to observe the distribution of the dye (attached to the TiO2) and to estimate the iodide in dye base solar cells, as illustrated in Figure 7, where concentration of the iodine changed from left to right as 600%, 200%, 100%, 50%, 0%. No dye was present in the clear parts on top of the cells.
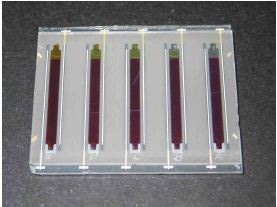
Figure 7. Image of the dye solar cell samples (sample courtesy of FraunhoferInstitute for Solar Energy Systems ISE).
At first, single spectra (10 accumulations with 2s integration time) were acquired from the areas without dye (through the 3mm glass) to assess the change in the spectra caused by the changes in the iodide concentration (Figure 8). The peak related to iodide (located near 110 rel.1/cm) is rising with iodide concentration. Nevertheless, the presence of iodide ions in the ionic liquid produces a significant peak at 0%.

Figure 8. The change in the spectra as a function of the iodine concentration: red = 0%; turquoise = 50%; black = 100%; green = 200%; blue = 600%.
The second step involved imaging the border area between the transparent area and the dye containing area through the 3mm glass. The image was captured using a 50X objective (NA 0.5) with 80x80 pixels (=6400 spectra) and a scan range of 50 x 50µm. A 532nm NdYag laser was applied for excitation. The resulting spectra are depicted in Figure 9 and Figure 10 shows the zoomed-in view of the finger-print area.
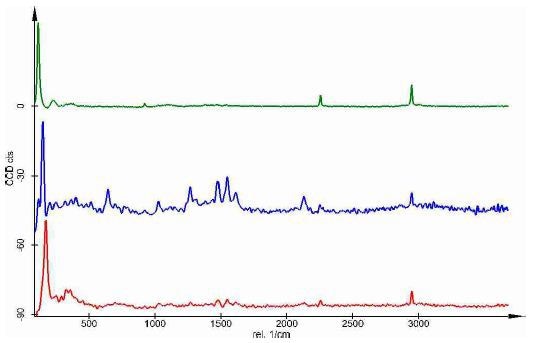
Figure 9. Typical Raman Spectra found in the border region of the dye solar cell.
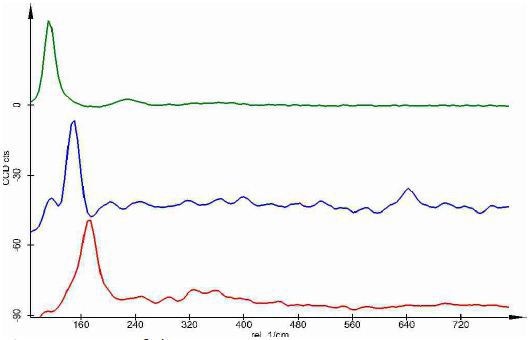
Figure 10. Zoom of the spectra as seen in Figure 9.
Figure 11 depicts the corresponding confocal Raman image with the colors representing where each spectrum can predominantly be found. The violet areas represent the mixture of the blue and red spectra. The image in conjunction with the spectra represents the presence of the ionic liquid plus the ACN (green spectrum) in the green area.
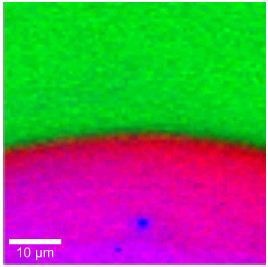
Figure 11. Raman Image of the border region of the dye solar cell.
The area filled as in standard dye solar cells (darker areas in Figure 7 and violet area in Figure 11) demonstrates a considerably lower signal for the green spectrum but a stronger signal of a mixture of the red and blue spectra. The blue spectrum illustrates the characteristic peaks of the dye near 1500 rel.1/cm, the intense peak near 155 rel.1/cm and characteristic peak at around 165 rel.1/cm.
Conclusion
The results clearly demonstrate the advantage of using Confocal Raman Imaging to analyze stress fields around laser-drilled holes on a Si solar cell and to study concentration-dependent properties of a dye solar cell.

This information has been sourced, reviewed and adapted from materials provided by WITec GmbH.
For more information on this source, please visit WITec GmbH.