Image Credits: Janaka Dharmasena/shutterstock.com
Lithium ion batteries are a leading energy storage technology for electronic portable devices and hybrid electric vehicles. Simultaneous characterization of the structure, chemical composition and elemental distribution in Li-ion battery materials can reveal the relationship between Li-ion transport, structural effects (phase transformation, internal stress), and battery performance and its degradation.
A long-standing challenge to understand Li-ion transport is based on the fact that this light atom cannot be detected using direct X-ray techniques (EDX, XRD and XAS) due to its weak scattering and emission properties. Nanoscale mapping can be achieved by multi-modal correlative microscopy which combines focused ion beam scanning electron microscopy (FIB-SEM), energy dispersive X-ray spectrometry (EDX) and Time-of-Flight Secondary Ion Mass Spectrometry (TOF-SIMS), as shown in figure 1.
The focused ion beam (FIB) is used to prepare a fresh cross-section of the battery under vacuum conditions which facilitates its direct, in-situ analysis without exposure to the atmosphere.
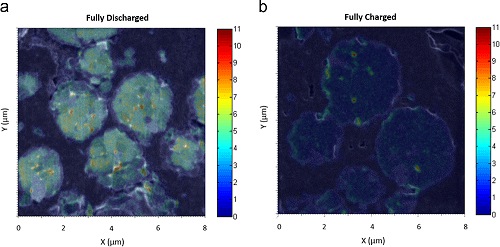
Figure 1: FIB cross-sections of a Li-ion battery electrode
3D Structural Analysis using FIB-SEM Tomography
Nano-structural changes in the electrodes that occur during charging-discharging cycles are among one of the most problematic degradation processes in Li-ion batteries. The mechanisms by which nano-degradation occurs are complex, involving multiple pathways. A lack of understanding of degradation processes represents a significant barrier towards the development of enhanced lithium-ion battery systems.
Degradation within the electrode can be observed using an FIB-SEM system such as the XEIA3 from Tescan. The FIB is used to mill the surface of the electrode to expose cross sections, which are then imaged via SEM to give images such as figure 1. This process is then continued layer by layer and the captured SEM images are stacked together to form an overall 3D image of the electrodes internal structure. By using FIB-SEM researchers can therefore create a 3D reconstruction of the electrode within a resolution of a few nanometers.
This visual reconstruction can be carried out on electrodes at different points in their charging lifecycle, allowing researchers to visualize the structural changes that occur over a lithium ion batteries lifetime. Figure 2 demonstrates the effect that an increasing number of charging cycles has on electrode morphology.
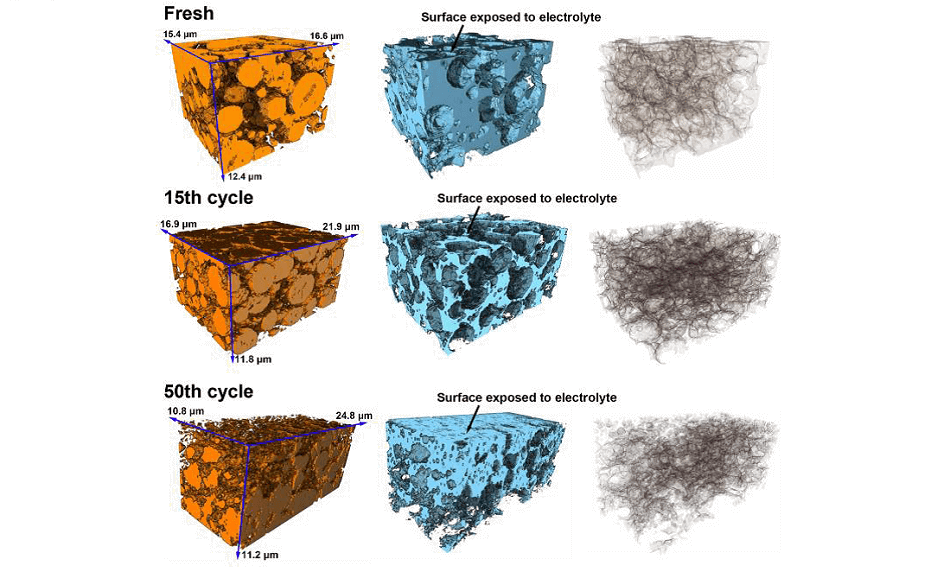
Figure 2: 3D reconstructions of electrodes at various cycling stages in terms of active particles (left), porosity with carbon black (middle) and phase interfaces (right). Courtesy of Dr. Bohang Song, University of Oxford
The cross sections taken by FIB-SEM (figure 1) are of a high enough resolution to determine the size of lithium based particles (consisting of Li(Li0.2Mn0.54Ni0.13Co0.13)O2) within the electrode. It is these particles that lithiate and delithiate during charge/discharge cycles, allowing the electrochemical cell to function. Measuring the size distribution of lithium particles in the electrode as the number of charging cycles increases provides insight into the mechanisms by which electrode degradation occurs.
It can be observed that the number density of ‘small’ (sub 200 nm) lithium particles increases as the number of charging cycles increases, confirming the fragmentation of the electrode. The 3D image provided by FIB-SEM indicates that fragmentation occurs more rapidly at the electrode-electrolyte interface – which confirms that degradation is linked to the lithiation/delithiation processes that occur during a charge/discharge cycle.
To understand the processes occurring within the particles which result in fragmentation, specific particles within the electrode can also be observed over the course of the experiment. The SEM images taken can be used to create nano-tomographic reconstructions of the particles.
These reconstructions show that many electrode particles contain small internal voids before any cycling has taken place, these are thought to be a direct result of the sintering process by which the electrode is formed. Over successive charging cycles the volume of these voids increases as the electrode degrades and ‘secondary particles’ break away.
SEM imaging of secondary particles allows researchers to observe that they have sharp, crystalline edges. This supports the conclusion that their shape is the result of compaction of lithium material during electrode formation, rather than the result of electrochemical grinding.
The information gathered by FIB-SEM on the distribution of degradation throughout the electrode and the increase in small particle density provides valuable information on battery behavior. Additionally, insights into the mechanisms of lithium-ion battery degradation, such as void growth and secondary particle formation, and how these could be linked to electrode formation processes can be used to design new, more effective processes of electrode formation.
EDX Analysis
EDX is the most common elemental mapping technique readily accessed in the SEM. EDX can be used to provide an elemental map of a samples surface, as shown in figure 3. However, a significant limitation of the performance of routine EDX is a low sensitivity to light elements (lighter than C) and almost no sensitivity to Li, which gives only weak scattering and low emissions.
This means that for lithium battery analysis EDX must be used alongside a technique which is sensitive towards lithium.
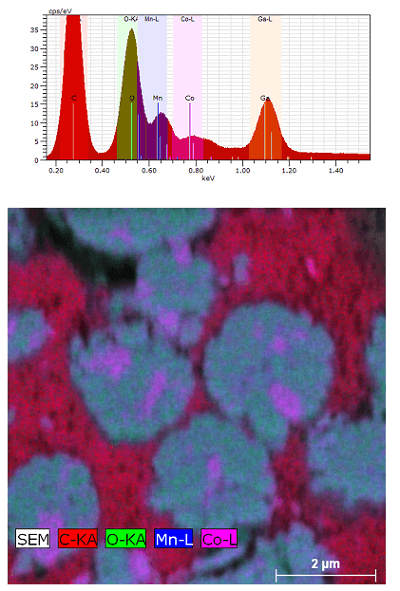
Figure 3: An EDX spectrum and elemental mapping of a Li-ion battery electrode
Supplementing EDX with TOF-SIMS
In contrast to EDX, TOF-SIMS is sensitive to lithium ions, as demonstrated in the mass spectra shown in figure 4, making it an attractive candidate for use in Li-ion battery research. TOF-SIMS allows changes in lithium distribution within a batteries internal structure to observed over the lifetime of the battery, which, as in the previous case study above, can be used to determine relationships between battery structure and performance.
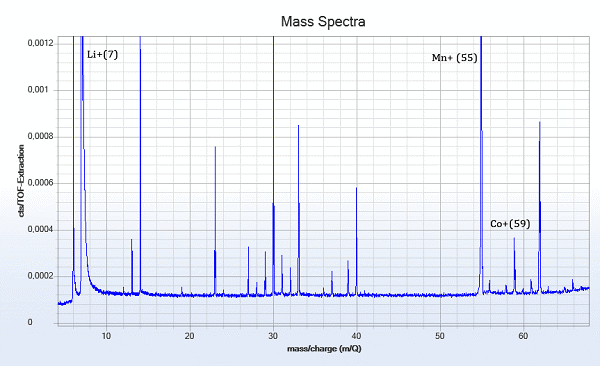
Figure 4: TOF-SIMS spectrum of a Li-ion battery electrode following 15 charging cycles, the main isotope Li ion peak ( 7 m/Q) is clearly visible.
The XEIA3 from Tescan can be equipped alongside an EDX system and TOF-SIMS analyzer to provide a full elemental map of a battery surface. The FIB from the XEIA3 can be used to ablate secondary ions from the battery materials surface, which can then be analyzed using TOF-MS. This data can be integrated with elemental data from EDX to provide an elemental map as in figure 3.
In addition to the creation of qualitative maps of Li distribution, TOF-SIMS enables quantitative analysis of the elements present. This allows the presence of phenomena such as trapped lithium in the battery material to be objectively quantified. Trapped lithium, where the ions are immobilized and unavailable for charge cycles, is a symptom of battery degradation.
TOF-SIMs imaging of battery surfaces shows that lithium trapping is a result of both grain boundaries and internal voids within the electrode. These structural features create barriers within the electrode, preventing the electrolyte access to regions of the electrode, rendering the lithium in these regions as useless. The extent of trapped lithium can be observed in the difference between the discharged and charged FIB secondary electron images, superimposed on a TOF-SIMS map, in figure 5.
Comparison of the Li concentration in fully charged and fully discharged battery electrodes can also be seen in figure 5.
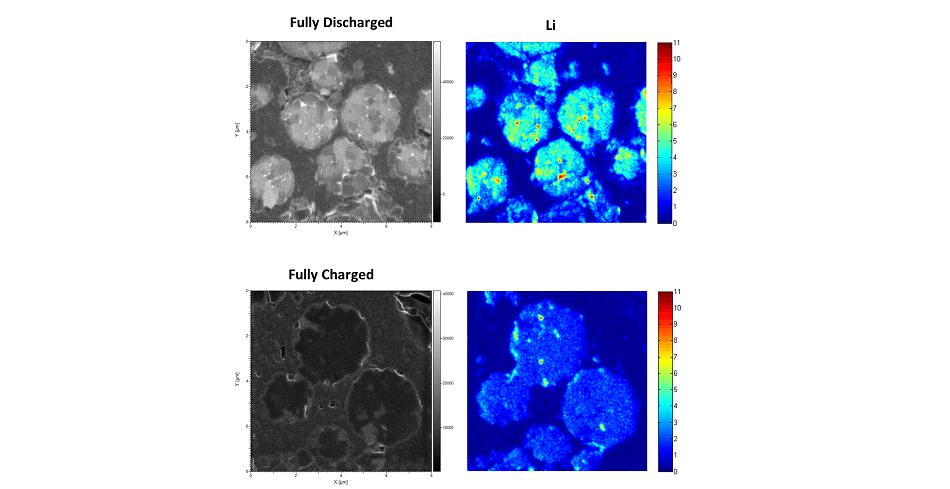
Figure 5: FIB secondary electron images with normalized elemental distribution maps of Li (7) are shown for fully dscharged (top row) and fully charged (bottom row) samples. The full field of view is 8 μm
Conclusions
The complex behavior of lithium ion batteries over their life cycle remains to be fully understood. In order to develop more powerful batteries, relationships between the batteries structure and chemistry, the production methods used to create the system, and the batteries performance must be further understood. FIB-SEM with the XEIA3 represents a powerful tool for lithium ion battery analysis.
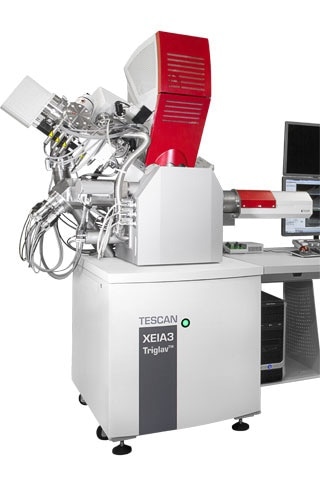
The XEIA3 FIB-SEM from Tescan
SEM allows the relationship between battery structure and activity to be further understood, whilst the ability to cross section afforded by FIB allows a high-resolution 3D image of the electrode to be created in-situ. Additionally, by combination with EDX and a TOF-SIMS detector, a nanoscale elemental map of Li, Mn and Co distributions within the battery can be created.
Download the Brochure for More Information
The combination of these powerful analytical techniques allows the micro-structural consequences of electrochemical changes, such as void growth and particle breakdown, to be observed and understood. Which, in turn, allows researchers to understand how lithium electrode design and construction can be optimized to reduce negative effects, thereby facilitating the design of superior Li-ion cathode materials.
References and Further Reading
- T. Sui, B. Song, J. Dluhos, L. Lu, A. M. Korsunsky, Nano Energy, 2015, DOI: 10.1016/j.nanoen.2015.08.013
- B. Song, T. Sui, S.Ying, L. Li, L. Lu and A. Korsunsky, J. Mater. Chem. A, 2015, DOI: 10.1039/C5TA04151A
TESCAN Group
Founded in 1991 by a group of managers and engineers from Tesla with its electron microscopy history starting in the 1950’s, today TESCAN is a globally renowned supplier of Focused Ion Beam workstations, Scanning Electron Microscopes and Optical Microscopes. TESCAN’s innovative solutions and collaborative nature with its customers have won it a leading position in the world of nano- and microtechnology. The company is proud to participate in premier research projects with prominent institutions across a range of scientific fields. TESCAN provides its clients with leading-class products in terms of value, quality and reliability. TESCAN Group is the North American arm of TESCAN Group, a multinational company established by the merger of Czech company TESCAN, a leading global supplier of SEMs and Focused Ion Beam workstations, and the French company ORSAY PHYSICS, a world leader in customized Focused Ion Beam and Electron Beam technology.

This information has been sourced, reviewed and adapted from materials provided by TESCAN Group.
For more information on this source, please visit TESCAN Group.