When we take a spectroscopy measurement we expect the result to be accurate and precise. However, how accurate and precise depends on many factors and in the real world every measurement will include a margin for error. In fact the results we get from our spectroscopy measurements are not complete unless we include the error, i.e. composition is an average of 20% with an error margin of +/- 0.2%.
.jpg)
The error margin is due to random variations in the measurement system and follows statistical rules. Learning these rules and how to apply them is the first step in estimating the error margin for our own spectroscopy measurements.
How Random Variations are Distributed
The range of values of a single variable in a population falls into what is termed a normal distribution, or bell curve.
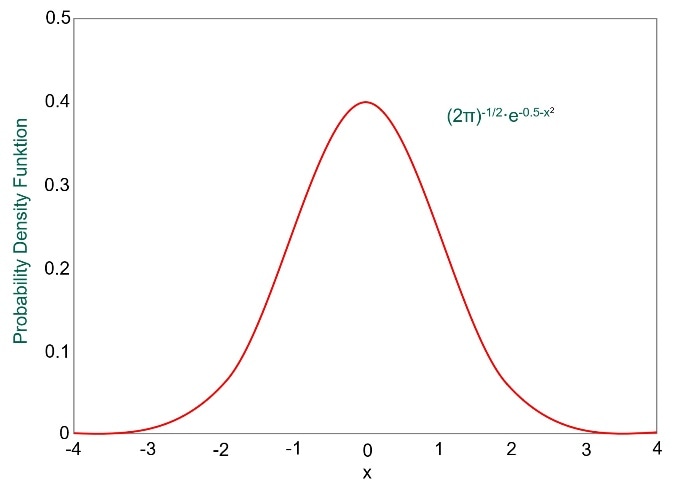
An example of this is height. Let’s say that we measured the height of all women and then plotted a graph of height on the y-axis vs number of women at that height on the x-axis. The graph would have a shape of the normal distribution curve above, showing most people with average height in the centre and the number of very tall and very short women trailing off to either side.
What is Standard Deviation?
If we look at the normal distribution curve, we can see that the broader the shape, the more values exist away from the mean value. Whereas a narrower curve means that more values are near the mean. The standard deviation, denoted by σ, gives us a numerical value that tells us how spread out the results are.
For a normal distribution, it is always the case that:
68.25% of results will be within one standard deviation (1 σ ) from the mean value
95.45% of results will be within two standard deviations (2 σ ) from the mean value
99.73% of results will be within three standard deviations (3 σ ) from the mean value
For spectroscopy measurements, the smaller the value of standard deviation, the narrower the normal distribution curve, and the more precise our measurements. Standard deviation (σ) can be calculated by the following formula:
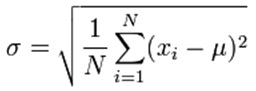
Where:
μ: population mean
xi: individual measured values
N: number of measurements made
Real World Applications
In the real world we don’t usually measure an entire population. Instead we measure a sample of a population.
In our field of spectroscopy, we don’t usually measure a large enough sample size to accurately calculate σ for an entire population. Instead, we measure a sample of the population. Fortunately, there’s a slightly modified expression we can use to estimate the sample standard deviation in this case. We use the symbol s to represent standard deviation of a sample.
The expression for s is:
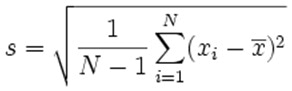
Where:
x̅ : mean value of all measurements made
xi: individual measured values
N: number of measurements made
We could use this sample standard deviation (s) to estimate the error margin in our spectroscopy measurements. If we wanted to be 95% sure of our results – and remembering that for a normal distribution 95.45% of results will be two standard deviations from the mean value – we’d end up with:
Concentration=<average value of all readings>% +/- 2 x s%
For example: to be 95% sure that our concentration is 20% +/- 0.2, s must equal 0.1.
However, for spectroscopy this isn’t quite accurate enough and there’s one more variable we need to consider. This is what we’ll cover in the next blog.
[CTA]
Want to Know More?
Soon our guide “The Search for True Values”, where we cover basic statistics, will be ready. In this we work through examples for actual spectroscopy measurements and explain what to do when you don’t have all the information you need to estimate the true error of your measurements. If you want to get a copy for download, please pre-register here.

This information has been sourced, reviewed and adapted from materials provided by Hitachi High-Tech Analytical Science.
For more information on this source, please visit Hitachi High-Tech Analytical Science.