Simultaneous thermogravimetric analyzers (STA) possess both DSC (differential scanning calorimetry) and TGA (thermogravimetric analysis) capabilities, all housed within a single instrument.
This article explores the reasons why many individuals and organizations opt to use STA instruments over standalone TGA, as well as outlining why the option to employ both techniques using a single instrument provides tangible benefits over standard DSC.
What Do We Learn by TGA Alone?
Thermogravimetric analysis is essentially a technique whereby a sample’s mass is monitored against temperature or time, while the sample’s temperature is controlled.
Standalone TGA is most commonly employed in compositional analysis; for example, determining the temperature at which a metallic material with a polymer coating starts to oxidize.

Image Credit: Hitachi High-Tech Analytical Science
The graph above displays a typical TGA output in an oxidative environment - the x axis shows temperature while the y axis shows weight. Here, the material matrix is heated and, as anticipated, the trace is relatively flat until organic material starts to burn off. At this point, there is a sharp reduction in weight.
Once the metallic component starts to oxidize, weight gradually increases before plateauing. This plateau occurs because there is no more available material in contact with oxygen.
By examining a more complex system than simple metal oxidation - for example, a sample of tire rubber - it is possible to see that TGA provides more information.
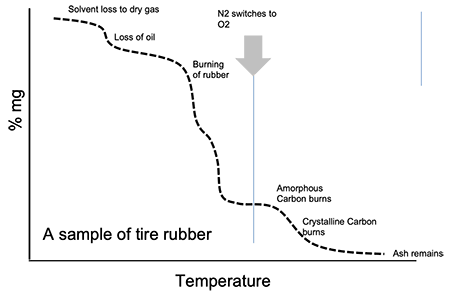
Image Credit: Hitachi High-Tech Analytical Science
The diagram above confirms that there are a number of notable changes in weight, explained by what is commonly understood to be happening, based on prior experience and general knowledge. These assumptions are one of the main issues with this technique. However, a drop in weight is assumed to be due to oil loss, but oil is not actually tested.
Ensuring that regulations are adhered to and that products’ reputation is maintained require more than just assumptions. Continuing the example above, determining whether the loss in weight is actually oil, ascertaining what type of oil is being lost or an analysis of evolved gasses would necessitate the use of an FTIR instrument or a mass spectrometer. Thankfully, it is possible to connect the NEXTA STA to one of these systems, allowing this type of analysis to be undertaken seamlessly.
Another key limitation of using standalone TGA is that it is only able to report changes in weight (or, more accurately, mass). While this technique and the resulting information is useful in partially understanding a sample’s characteristics, this is not sufficient to, for example, properly understand detailed changes within a material over a temperature range. Understanding these changes is important in better predicting future performance.
Why Adding DSC to TGA Provides Better Insight
Many organizations and individuals opt to use STA rather than TGA, because STA offers some DSC capability along with full TGA capabilities, all within a single instrument. An investigation into the melting behavior of PET can help illustrate this difference in capabilities.
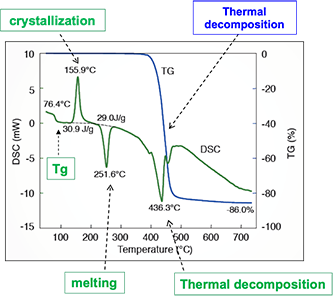
Image Credit: Hitachi High-Tech Analytical Science
The blue line above represents TGA output while the green line represents DSC output. DSC measures the change in sample temperature against a control sample, with peaks relating to exothermic reactions, and troughs relating to endothermic reactions.
One striking aspect of the above diagram is the amount of activity in the flat portion of the TGA curve. This curve shows a glass transition, cold crystallization and melting occurring, even before the thermal decomposition that both the techniques would be able to indicate.
It is possible to utilize outputs from both DSC and TGA in tandem to accurately explain the type of thermal processes taking place within a sample. A thermal decomposition will be observed as a drop in weight coupled with an endothermic peak, while oxidation is observed as a gain in weight coupled with an increase in energy. The table below provides further examples.
Source: Hitachi High-Tech Analytical Science
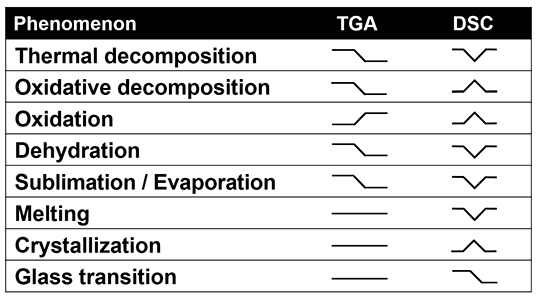
It should be noted that, in practice, it is usually possible to ascertain whether or not dehydration is taking place by looking at the specific shape of the DSC curve. This curve, in combination with quantitative results acquired using the TGA part of the STA, allows users to gain an in-depth understanding of this process. Here, the DSC curve helps users to understand what type of thermal process is taking place during this analysis.
STA Increases the Capabilities of DSC
The peak temperature of a typical DSC instrument is generally around 700 ºC. This is considerably less than the temperature range of a STA instrument, which is able to rise from ambient temperature to more than 1000 ºC – in fact, the Hitachi High-Tech STA 300 is able to reach 1500 ºC.
The DSC technique is ideal for use over a high temperature range, and this is perfectly illustrated by an investigation into iron. The graph below displays results from analysis of iron in the high temperature range, using DTA (differential thermal analysis), DSC and TGA.
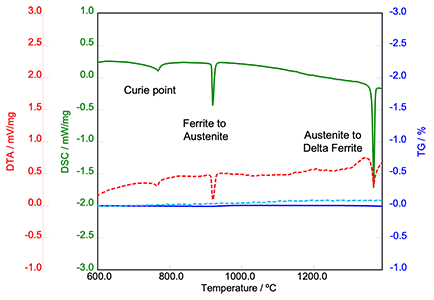
Image Credit: Hitachi High-Tech Analytical Science
The Curie Point is clearly visible at 770 ºC, followed by the ferrite to austenite transition and then the austenite to delta ferrite transition. These transitions are important when establishing material behavior of the metals during welding (a high-temperature activity).
Because material properties can change considerably with carbon content, it is possible to run a scan to predict at what phase the material would be at when it reaches the weld temperature. This information can facilitate predictions around ease of welding and weld integrity.
A further use of high temperature DSC is in the evaluation of the melting points of metals such as silver and copper - information which is vital in the analysis of circuit board performance.
Measuring Heat Capacity Analysis with the NEXTA STA
The NEXTA STA accurately measures heat capacity analysis (Cp). It can perform these measurements at a higher temperature than a standalone DSC – using modulated DSC, the NEXTA STA is capable of measuring Cp from ambient room temperature up to 1500 ºC.
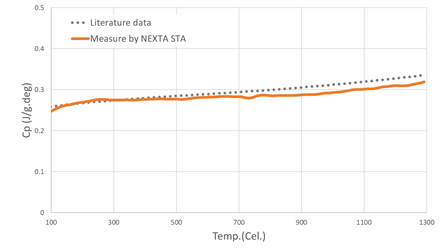
Image Credit: Hitachi High-Tech Analytical Science
This capability can be combined with the RealView Camera to visually illustrate changes in the sample over time and temperature. The ability to visually see dimension change and color measurement makes it easier to troubleshoot artifacts observed during an STA experiment.
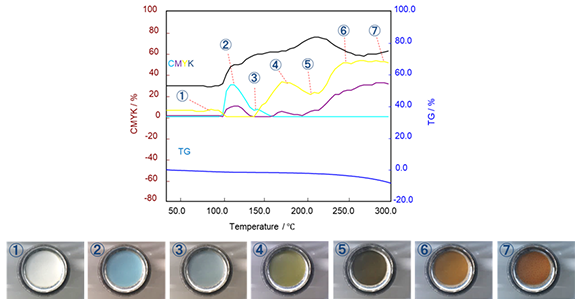
Image Credit: Hitachi High-Tech Analytical Science
As previously mentioned, to have full analysis capabilities, many users choose to purchase both a DSC and an STA. STA is an integrated technique that allows users to gain more information than a standalone TGA, regardless of the experiment in question.
The Hitachi NEXTA STA Range
The NEXTA STA successfully combines both TGA and DSC capabilities up to 1500 ºC, allowing it to deliver extremely detailed thermal imaging and analysis. Industry-leading baseline performance is combined with superior accuracy and precision, ensuring reliable quantitative analysis, even when working with trace amounts of material. Furthermore, the capabilities of the RealView camera system mean that experiments can be watched in real time.
Acknowledgments
Produced from materials originally authored by Ashley-Kate McCann from Hitachi High Technologies.

This information has been sourced, reviewed and adapted from materials provided by Hitachi High-Tech Analytical Science.
For more information on this source, please visit Hitachi High-Tech Analytical Science.