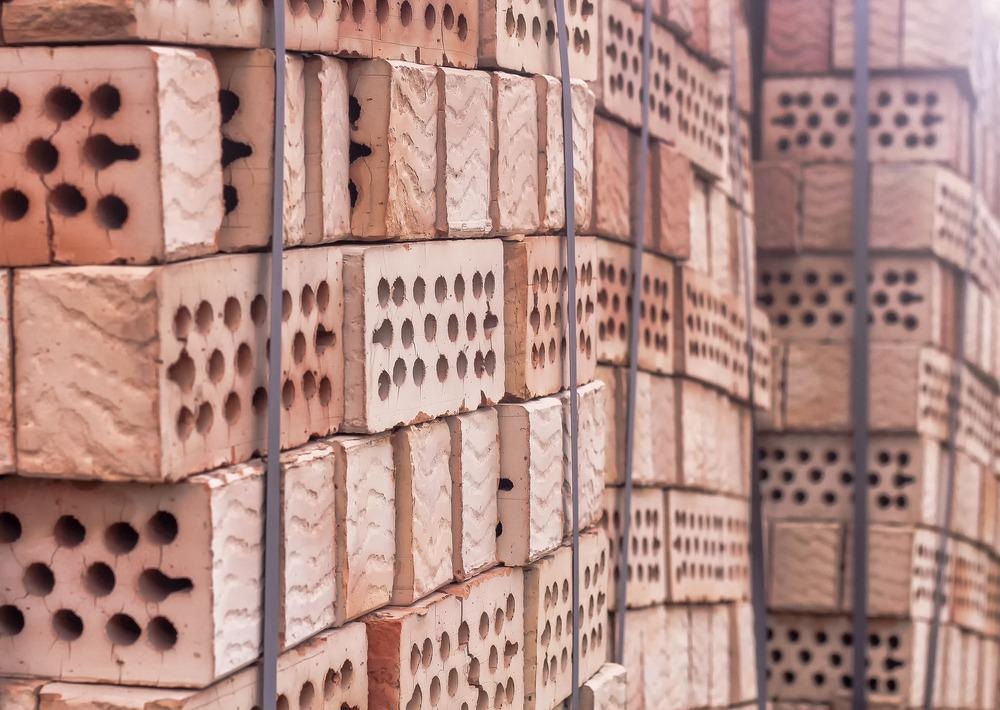
Bricks are an essential construction material used extensively around the world. Each year, nearly 1500 billion bricks are produced globally. However, according to the PWC report, Melbourne is facing a clay shortage. This article displays and considers the findings of a study published in the journal Buildings that considers the use of beer bottles in bricks, to minimize environmental impact and overcome shortages.
Study: Recycling Crushed Waste Beer Bottle Glass in Fired Clay Bricks. Image Credit: Kardasov Films/Shutterstock.com
A single brick creates 0.61 kg of CO2 over its life cycle; the firing process of 250 billion bricks releases about 40.65–42.64 Tg CO2 into the atmosphere every year, resulting in climate warming. Thus, adding wastes into bricks is a method for addressing the pollution problem. Components such as rice husks, rubber, sawdust, various types of sludge, and recycled paper have proved advantageous to the environment and the final product.
Many studies have used beer bottles as waste glass additives because they are accessible, cheap, and have a low melting point of around 1000 °C. A study published in the journal Buildings aimed to investigate the potential of recycling waste beer bottle glass (BG) in fired clay bricks.
Methodology
Around 30 kg of a clay soil sample from a trusted brick manufacturer was used to produce the required amount of brick samples. Table 1 shows the geotechnical properties of the brick soil used in this study. The clay soil was initially collected in metal trays and oven-dried at 105 °C for 24 hours.
| Properties |
Brick Soil |
| Liquid limit (%) |
32 |
| Plastic Limit (%) |
19 |
| Plasticity Index (%) |
13 |
Table 1. Geotechnical properties of the brick soil. Source: Xin, et al., 2021.
The soil was crushed using a hammer and sieved using 200 μm sieves. Nineteen 330 mL recyclable beer bottles were collected for this study.
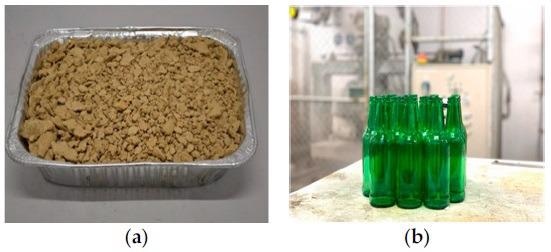
Figure 1. (a) Clay soil; (b) Beer bottles used in this study. Image Credit: Xin, et al., 2021.
After cleaning and oven-drying, a hammer was used to crush the BG into fragments. Next, a ball mill was used for 24 hours to crush the BG fragments into BG powder. XRD analysis was employed to identify the main crystalline phases.
XRF analysis helped determine the major chemical components and oxides of the experimental clay soil and BG powder. Mixture proportions of specimens by weight (g) and the firing temperature are summarized in Table 2.
| Set Number |
Qty. of Samples |
BG Content % (by Weight) |
Firing Temperature |
| S1 |
6 |
10% |
1050 °C |
| S2 |
6 |
10% |
1000 °C |
| S3 |
6 |
10% |
950 °C |
| S4 |
6 |
10% |
900 °C |
| S5 (control) |
6 |
0% |
1050 °C |
Table 2. Mixture proportions of specimens by weight (g) and the firing temperature. Source: Xin, et al., 2021.
Five sets of six bricks were primarily prepared, leading to 30 bricks. Sets 1, 2, 3, and 4 had the same moisture content of 15% and 10% BG, which were fired at temperatures of 1050 °C, 1000 °C, 950 °C, and 900 °C, respectively. Set 5 was treated as the control batch (0% BG) and was fired at 1050 °C. The optimum moisture content (OMC) was found to be 15%.
All bricks were oven-dried for 24 hours at 105 °C, followed by air-drying for 48 hours. The control bricks were placed into a furnace with a ramp rate of 0.7 °C/minute at 1050 °C and kept at this temperature for 3 hours. The remaining five batches were placed in a furnace with a ramp rate of 0.7 °C/minute at temperatures 900 °C, 950 °C, 1000 °C, and 1050 °C.
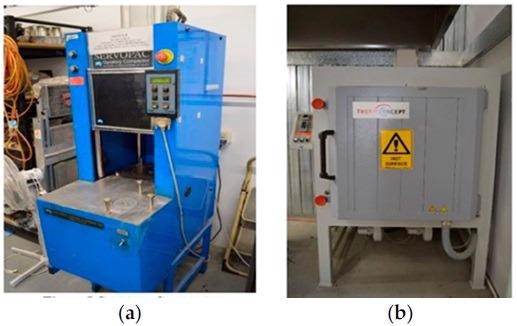
Figure 2. (a) Servopac gyratory compactor; (b) electric furnace. Image Credit: Xin, et al., 2021.
After firing, the bricks remained in the furnace until all bricks cooled down to room temperature. The controlled brick samples were compared to the BG modified bricks to verify whether the addition of BG has the potential to decrease firing temperature.
The maximum load and compressive strength of each brick sample were determined.
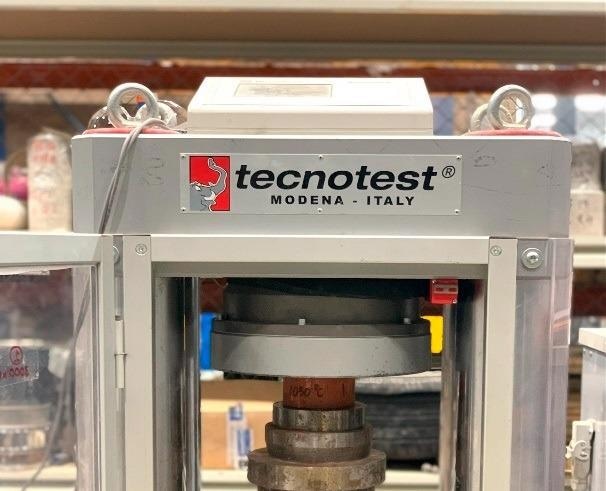
Figure 3. Tecnotest machine (K300/EUT). Image Credit: Xin, et al., 2021.
Thermal conductivity is an essential criterion for building materials and was hence tested (see Figure 4). The measurements were carried out at an average temperature of 20 ± 2 °C. The test was performed three times for each sample, the mean of the three measurements was adopted, and a 15-minute interval time was applied between each test.
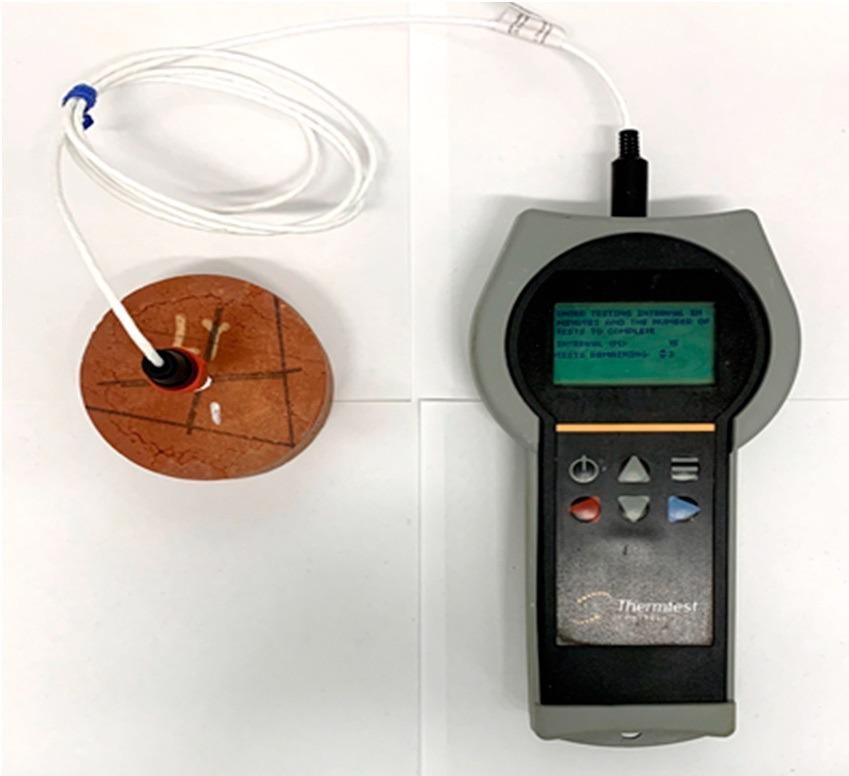
Figure 4. Thermal conductivity test. Image Credit: Xin, et al., 2021.
The weight of the specimen after oven-drying was recorded. The following step was to place the bed surface of the dry specimen on the bars for a period of 60 ± 1 second, measured from the time the specimen made contact with the water.
The next step was to remove the specimen from the water and immediately wipe it with a damp cloth and determine its mass (m2 in grams). The weighing was completed within 1 minute of the removal of the specimen from the water tank.
The specimens were oven-dried for 24 h at 105 °C after the initial rate of absorption test. The samples were weighed after they were fired and then cooled down to room temperature and recorded. Then, the bricks were placed into cold water at ambient temperature for 24 hours.
After 24 hours, they were removed from the cold water and drained for 1 minute; any remaining water on the bricks’ surface was dried with a damp paper within 3 minutes, and the bricks were weighed again and recorded.
After the cold-water test, the specimens were placed on the grid in the water bath, and all surfaces of the specimens were covered by at least 25 mm of water. The water was rapidly heated to 100 °C in approximately 1 hour and maintained at this temperature for 5 hours. Then, the specimen was cooled uniformly and left in the tank for more than 3 hours.
The next step involved removing the bricks from the cold water, draining for 1 minute, and removing any remaining water on the bricks’ surface using damp paper within 3 minutes. The bricks were weighed again and recorded.
Results and Discussion
Table 3 shows the main compound found in the soil and BG powder is silicon (Si).
| Chemical Components |
Concentration |
| Clay Soil (%) |
BG (%) |
| Na |
0.14 |
4.37 |
| Mg |
0.48 |
0.39 |
| Al |
7.08 |
0.92 |
| Si |
21.86 |
24.02 |
| Ca |
0.16 |
8.94 |
| Ti |
0.66 |
0.04 |
| Cr |
0.02 |
0.16 |
| Fe |
5.22 |
0.67 |
| Na2O |
0.33 |
8.47 |
| SiO2 |
46.92 |
52.13 |
| K2O |
3.53 |
0.91 |
| Fe2O3 |
5.64 |
0.69 |
| CaO |
0.18 |
10.01 |
Table 3. Chemical components and oxides found in clay soil and BG. Source: Xin, et al., 2021.
Sieve analysis demonstrated the particle size distribution.
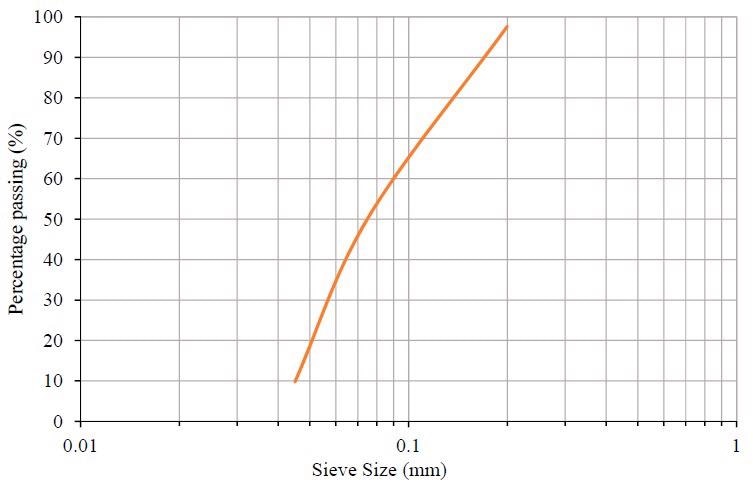
Figure 5. Particle size distribution. Image Credit: Xin, et al., 2021.
Compressive strength is an essential parameter to determine the quality of bricks. From Figure 6, it can be seen that all of the tested bricks overwhelmingly satisfy this limit.
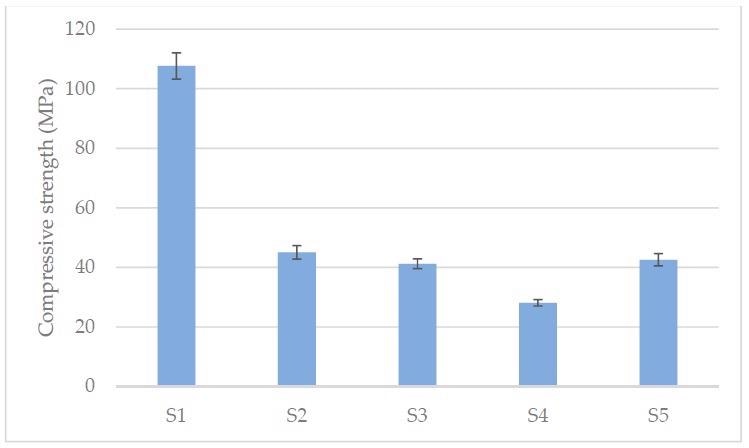
Figure 6. Compressive strength results. (S1-10% BG fired at 1050 °C, S2-10% BG fired at 1000 °C, S3-10% BG fired at 950 °C, S4-10% BG fired at 900 °C, S5-Control 0% BG fired at 1050 °C). Image Credit: Xin, et al., 2021.
Table 4 illustrates the shrinkage properties of the manufactured bricks. The average initial drying shrinkage, firing shrinkage, and total shrinkage values of four brick samples from each set were measured and represented in height and diameter.
| Type of Shrinkage |
Type of Brick Diametric (%) |
Diametric (%) |
Height (%) |
| Initial drying shrinkage |
S1 10% BG 1050 °C |
1.34 |
1.26 |
| S2 10% BG 1000 °C |
1.38 |
1.23 |
| S3 10% BG 950 °C |
1.30 |
1.02 |
| S4 10% BG 900 °C |
1.44 |
1.20 |
| S5 0% control BG 1050 °C |
2.07 |
1.27 |
| Firing shrinkage |
S1 10% BG 1050 °C |
5.91 |
2.80 |
| S2 10% BG 1000 °C |
5.36 |
2.17 |
| S3 10% BG 950 °C |
2.97 |
1.29 |
| S4 10% BG 900 °C |
0.75 |
0.51 |
| S5 0% control BG 1050 °C |
3.97 |
2.10 |
| Total shrinkage |
S1 10% BG 1050 °C |
7.24 |
4.06 |
| S2 10% BG 1000 °C |
6.74 |
3.40 |
| S3 10% BG 950 °C |
4.27 |
2.31 |
| S4 10% BG 900 °C |
2.19 |
1.71 |
| S5 0% control BG 1050 °C |
6.04 |
3.37 |
Table 4. Shrinkage test results. Source: Xin, et al., 2021.
Table 5 shows that the average dry density decreased with the decrease in firing temperature, and the thermal conductivity decreased with the decrease in firing temperature.
| Type of Brick Average |
Thermal Conductivity (W/mK) |
Average Dry Density (kgm-3) |
| S1 10% BG 1050 °C |
0.84 |
2300 |
| S2 10% BG 1000 °C |
0.81 |
2200 |
| S3 10% BG 950 °C |
0.81 |
2100 |
| S4 10% BG 900 °C |
0.62 |
2000 |
| S5 0% control BG 1050 °C |
0.49 |
2100 |
Table 5. Thermal conductivity. Source: Xin, et al., 2021.
XRD analysis showed that quartz, rutile, hematite, tridymite, pseudorutile, and muscovite were the main phases in the brick specimens (Figure 7), incorporating 0% and 10% BG at various temperatures (900 °C, 950 °C, 1000 °C, and 1050 °C).
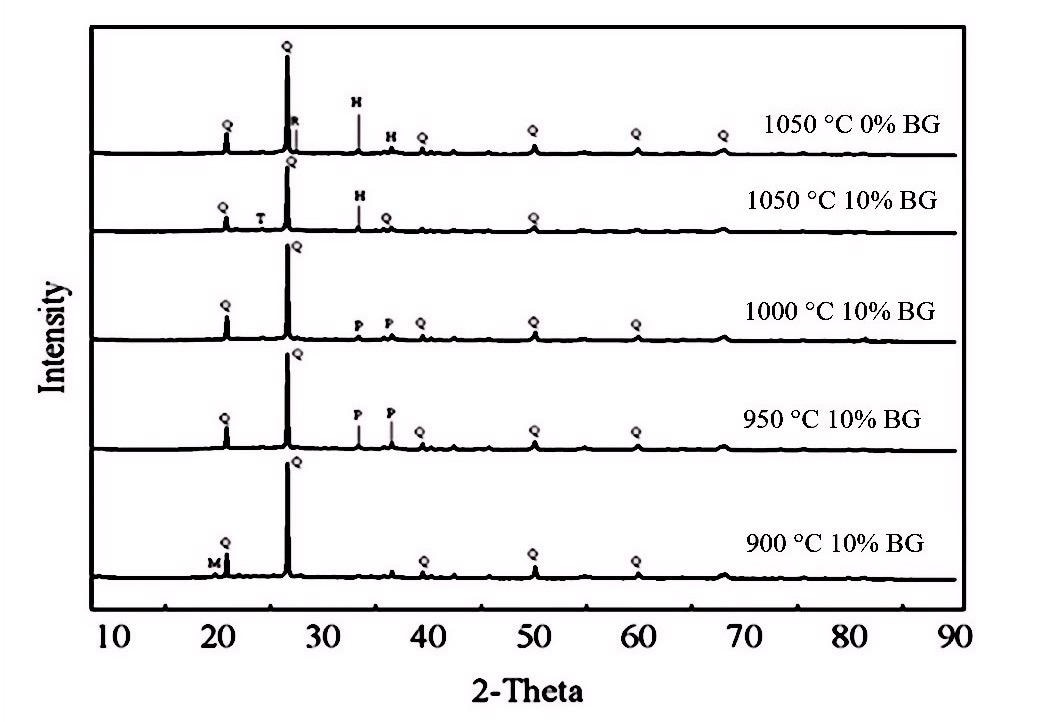
Figure 7. XRD patterns. (Q-Quartz, R-Rutile, H-Hematite, T-Tridymite, P-Pseudorutile, and M-Muscovite). Image Credit: Xin, et al., 2021.
The IRA test (see Table 6) was used to determine the amount of water in grams absorbed in one minute over the bed face of the brick. Water infiltration is an essential parameter of brick durability.
| Sample |
Average IRA (Gross) (kg/m2) |
| S1 10% BG 1050 °C |
0.89 |
| S2 10% BG 1000 °C |
1.31 |
| S3 10% BG 950 °C |
1.94 |
| S4 10% BG 900 °C |
3.58 |
| S5 0% control BG 1050 °C |
1.72 |
Table 6. IRA values. Source: Xin, et al., 2021.
The results of the cold-water immersion test and boiling water test are shown in Table 7. The saturation coefficient (SC) results of all tested bricks were below the maximum required absorption value of 17% (see Table 8).
| Sample |
Wi* (Average) |
Wb * (Average) |
Saturation Coefficient |
| S1 10% BG 1050 °C |
0.43 |
1.85 |
0.23 |
| S2 10% BG 1000 °C |
3.30 |
4.87 |
0.68 |
| S3 10% BG 950 °C |
9.42 |
10.84 |
0.87 |
| S4 10% BG 900 °C |
12.02 |
13.59 |
0.88 |
| S5 0% control BG 1050 °C |
7.10 |
8.55 |
0.83 |
Table 7. Coldwater 24-hour immersion test results. Source: Xin, et al., 2021. * Note: Wi = percentage cold water immersion absorption of the specimen; Wb = percentage boiling water absorption of the specimen; Saturation coefficient = the ratio between the Wi and Wb.
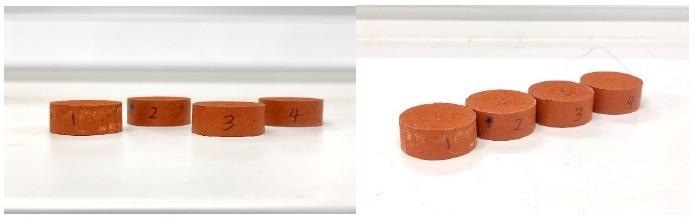
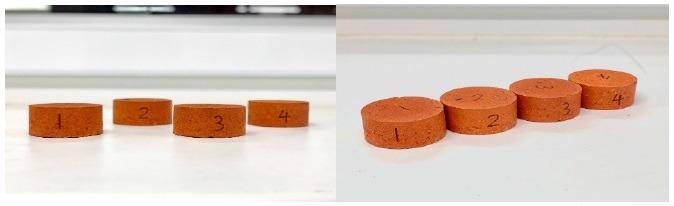
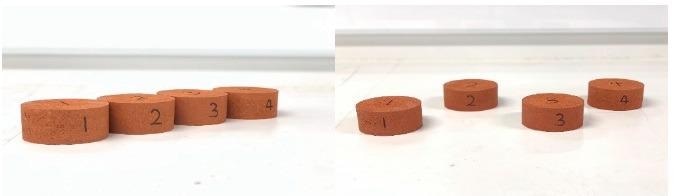
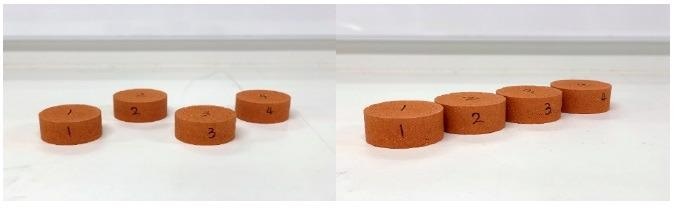
From a building, fabricator, and customer perspective, the color of the brick produced is essential. Table 9 illustrates pictures of the manufactured brick specimens. The color of controlled bricks was darker than the color of bricks containing 10% BG due to the addition of BG.
| Set Number 1 (10% glass fired at 1050 °C) |
 |
| Set Number 2 (10% glass fired at 1000 °C) |
 |
| Set Number 3 (10% glass fired at 950 °C) |
 |
| Set Number 4 (10% glass fired at 900 °C) |
 |
| Set Number 5 (Control 0% glass firing at 1050 °C) |
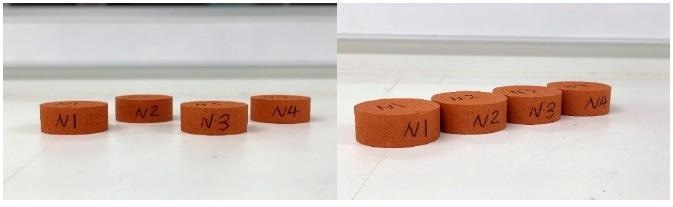 |
Table 9. Manufactured brick specimens. Source: Xin, et al., 2021.
Conclusion
This study investigated whether beer bottle glass (BG) can be recycled in fired-clay bricks and investigated the relationship between the firing temperature and the corresponding physical and mechanical properties and thermal conductivity.
The maximum compressive strength (113.93 MPa) was achieved with the addition of 10% BG at a firing temperature of 1050 °C. The tested bricks satisfied the maximum recommended water absorption value of 17%.
Thermal conductivity test results proved that the density and firing temperatures affected thermal conductivity performance. All of the manufactured bricks in this study satisfied the requirements of Australian standards.
Therefore, recycling waste glass in fired clay bricks can solve a growing world waste calamity, minimize the stockpile in landfills, and potentially reduce firing temperatures to 900 °C because BG helps form the glass phases at a temperature above 850 °C.
Journal Reference:
Xin, Y., Kurmus, H., Mohajerani, A., Dallol, Y., Lao, Y., Robert, D., Pramanik B., Tran, P. (2021) Recycling Crushed Waste Beer Bottle Glass in Fired Clay Bricks. Buildings. Available at: https://www.mdpi.com/2075-5309/11/10/483
References and Further Reading
- Mohajerani, A., et al. (2016) A practical proposal for solving the world’s cigarette butt problem: Recycling in fired clay bricks. Waste Management, 52, pp. 228–244. doi.org/10.1016/j.wasman.2016.03.012.
- PWC (2016). Extractive Resources in Victoria: Demand and Supply Study 2015–2050 Final Report; Earth Resources Victoria: Melbourne, VIC, Australia.
- Nath, A. J., et al. (2018) Fired bricks: CO2 emission and food insecurity. Global Challenges, 2, p. 1700115. doi.org/10.1002/gch2.201700115.
- Chiang, K.-Y., et al. (2009) Lightweight bricks manufactured from water treatment sludge and rice husks. Journal of Hazardous Materials, 171, pp. 76–82. doi.org/10.1016/j.jhazmat.2009.05.144.
- Alonso-Santurde, R., et al. (2012) Recycling of foundry by-products in the ceramic industry: Green and core sand in clay bricks. Construction and Building Materials, 27, pp. 97–106. doi.org/10.1016/j.conbuildmat.2011.08.022.
- Mohajerani, A., et al. (2019) A Proposal for Recycling the World’s Unused Stockpiles of Treated Wastewater Sludge (Biosolids) in Fired-Clay Bricks. Buildings, 9, p. 14. doi.org/10.3390/buildings9010014.
- Vlasova, M., et al. (2018) Development of an energy- and water-saving manufacturing technology of brick products. Science of Sintering, 50, pp. 275–289. doi.org/10.2298/SOS1803275V.
- Phonphuak, N., et al. (2016) Utilisation of waste glass to enhance physical–mechanical properties of fired clay brick. Journal of Cleaner Production, 112, pp. 3057–3062. doi.org/10.1016/j.jclepro.2015.10.084.
- NetBalance (2014) Market Summary–Recycled Glass; Sustainability Victoria: Melbourne, VIC, Australia.
- Standards Australia (2017) Methods of Testing Soils for Engineering Purposes Soil Compaction and Density Tests; (AS/NZS 1289.5.1.1); SAI Global Limited: Chicago, IL, USA.
- Standards Australia (2003) Masonry Units and Segmental Pavers and Flags; (AS/NZS 4456.4); SAI Global Limited: Chicago, IL, USA.
- Standards Australia (2008) Methods of Testing Soils for Engineering Purposes—Soil Classification Tests (Determination of the Linear Shrinkage of a Soil—Standard Method); (AS 1289.3.4.1); SAI Global Limited: Chicago, IL, USA.
- Standards Australia (2003) Masonry Units and Segmental Pavers and Flags—Methods of Test Determining Initial Rate of Absorption (Suction); (AS/NZS 4456.17); SAI Global Limited: Chicago, IL, USA.
- Standards Australia (2003) Masonry Units and Segmental Pavers and Flags—Methods of Test Determining Water Absorption Properties; (AS/NZS 4456. 14); SAI Global Limited: Chicago, IL, USA.
- Velasco, P. M., et al. (2014) Fired clay bricks manufactured by adding wastes as sustainable construction material—A review. Construction and Building Materials, 63, pp. 97–107. doi.org/10.1016/j.conbuildmat.2014.03.045.
- Kurmus, H & Mohajerani, A (2021) Energy savings, thermal conductivity, micro and macro structural analysis of fired clay bricks incorporating cigarette butts. Construction and Building Materials, 283, p. 122755. doi.org/10.1016/j.conbuildmat.2021.122755.
- Standards Australia (2009) Soil Classification Tests—Determination of the Particle Size Distribution of a Soil-Standard Method of Analysis by Sieving; (AS 1289.3.6.1); SAI Global Limited: Chicago, IL, USA.
- Demir, I (2009) Reuse of waste glass in building brick production. Waste Management & Research, 27, pp. 572–577. doi.org/10.1177/0734242X08096528.
- Abdeen, H H & Shihada, S M (2016) Properties of Fired Clay Bricks Mixed with Waste Glass. Journal of Scientific Research and Reports, 13, pp. 1–9. doi.org/10.9734/JSRR/2017/32174.
- Demir, I (2008) Effect of organic residues addition on the technological properties of clay bricks. Waste Management, 28, pp. 622–627. doi.org/10.1016/j.wasman.2007.03.019.
- Kazmi, S. M. S., et al. (2018) Thermal performance evaluation of eco-friendly bricks incorporating waste glass sludge. Journal of Cleaner Production, 172, pp. 1867–1880. doi.org/10.1016/j.jclepro.2017.11.255.
- Chandrasekaran, E., et al. (2018) The effect of temperature on ceramic bricks with replacing waste glass in low volume ratio. International Journal of Advanced Science and Research, 3, pp. 79–86.
- Standards Australia (2018) Masonry Structures; (AS 3700); SAI Global Limited: Chicago, IL, USA.
- ASTM International (2017) ASTM C62 Standard Specification for Building Brick (Solid Masonry Units Made from Clay or Shale); ASTM International: West Conshohocken, PA, USA.
- Federico, L M (2006) Effects of Waste Glass Addition on the Properties of Fired Clay Brick. Ph.D. Dissertation, McMaster University, Hamilton, ON, Canada.
- Dondi, M., et al. (2009) Recycling PC and TV waste glass in clay bricks and roof tiles. Waste Management, 29, pp. 1945–1951. doi.org/10.1016/j.wasman.2008.12.003.
- Xin, Y., et al. (2021) Possible recycling of waste glass in sustainable fired clay bricks: A review. International Journal of GEOMATE, 20, pp. 57–64. doi.org/10.21660/2021.78.Gx260.