Nickel is derived from two extremely different ores; lateritic and sulfidic. Lateritic ore is typically found in tropical countries, such as Indonesia and mined from multiple depths beneath the surface, while sulfidic ore is generally found in combination with copper ore through underground mining.
As nickel is an essential component of the lithium-ion batteries that are used in electric vehicles and other everyday devices, there has recently been a significant surge in demand for nickel production.
Resultingly, a rapid and accurate analysis method is necessary for the precise quantification of these ores across both the mining and refining processes.
X-Ray fluorescence spectrometry (XRF) is a long-established, high accuracy analytical method that has the ability to establish chemical composition in materials with minimum sample preparation, making it the preferred technique in process and quality control across a number of industries.
Instrumentation
The Thermo Scientific™ ARL OPTIM’X™ WDXRF Spectrometer has been developed with easy operation in mind and with maintenance costs completely minimized.
The instrument includes a Thermo Scientific SmartGonio, which is able to cover elements from fluorine (9F) to uranium (92U). Two different versions exist, either in 50 W or the new 200 W version. The 50 W version was employed for the tests outlined in this article.
External or internal water cooling is not necessary with this instrument which possesses 10 times better spectral resolution than a traditional EDXRF instrument as well as best-in-class precision and stability. It has an outstanding performance for sodium (11Na), magnesium (12Mg) and fluorine (9F).
Analytical Conditions
As Table 1 demonstrates, spectra were taken from each Nickel Ore sample for an overall analysis time of 10.4 minutes utilizing the ARL OPTIM’X at 50 W power. Measurement time can be better calibrated as required for each specific application.
Table 1. Analytical Conditions. Source: Thermo Fisher Scientific – Materials & Structural Analysis
| Name |
Component type |
Analysis Time [s] |
kV |
mA |
| Ni Ka 1,2 |
Gonio XRF |
36 |
30 |
1.67 |
| Zn Ka 1,2 |
Gonio XRF |
60 |
30 |
1.67 |
| Cr Ka 1,2 |
Gonio XRF |
36 |
30 |
1.67 |
| Ti Ka 1,2 |
Gonio XRF |
36 |
30 |
1.67 |
| Si Ka 1,2 |
Gonio XRF |
36 |
30 |
1.67 |
| S Ka 1,2 |
Gonio XRF |
36 |
30 |
1.67 |
| P Ka 1,2 |
Gonio XRF |
60 |
30 |
1.67 |
| Mg Ka 1,2 |
Gonio XRF |
60 |
30 |
1.67 |
| K Ka 1,2 |
Gonio XRF |
60 |
30 |
1.67 |
| Ca Ka 1,2 |
Gonio XRF |
36 |
30 |
1.67 |
| Al Ka 1,2 |
Gonio XRF |
36 |
30 |
1.67 |
| Mn Ka 1,2 |
Gonio XRF |
36 |
30 |
1.67 |
| Co Ka 1,2 |
Gonio XRF |
60 |
30 |
1.67 |
| Fe Ka 1,2 |
Gonio XRF |
36 |
30 |
1.67 |
Overall counting time can be reduced by a factor of 2.5 when using the 200 W version of ARL OPTIM’X while still achieving equivocal accuracy and precision. Thus, overall analysis time would decrease to around 4 minutes.
Sample Preparation
Calibration was conducted with 18 Nickel Ore CRMs. Samples with a sample to flux ratio of 1:20 were consolidated into beads without ignition. Ammonium nitrate oxidizer was then introduced into the fusion mix.
Table 2 displays the concentration ranges of the various oxides the calibration covers. The R2 and SEE (Standard Error of Estimates) values were acquired for each of the different compounds.
Table 2. Concentration ranges and calibration parameter values for the analysis of Nickel Ore. Source: Thermo Fisher Scientific – Materials & Structural Analysis
| Element |
Calibration |
R2 |
SEE |
| N |
Min % |
Max % |
| Al2O3 |
17 |
1.599 |
17.470 |
0.9998 |
0.0813 |
| CaO |
18 |
0.133 |
3.106 |
0.9999 |
0.0096 |
| Cr2O3 |
17 |
0.170 |
1.750 |
0.9980 |
0.0204 |
| Fe2O3 |
15 |
12.728 |
45.990 |
0.9998 |
0.1521 |
| K2O |
5 |
0.069 |
0.228 |
0.9831 |
0.0089 |
| MgO |
17 |
0.742 |
27.306 |
0.9998 |
0.1551 |
| MnO |
18 |
0.109 |
1.940 |
0.9996 |
0.0096 |
| NiO |
18 |
0.066 |
3.740 |
0.9996 |
0.0214 |
| SiO2 |
16 |
22.790 |
47.970 |
0.9993 |
0.2415 |
| TiO2 |
13 |
0.035 |
1.360 |
0.9998 |
0.0063 |
| Co3O4 |
16 |
0.031 |
0.123 |
0.9921 |
0.0027 |
| P2O5 |
7 |
0.005 |
0.173 |
0.9847 |
0.0099 |
| SO3 |
7 |
0.004 |
0.189 |
0.9763 |
0.0108 |
| ZnO |
18 |
0.009 |
0.044 |
0.9504 |
0.0023 |
Calibration
Calibration curves derive from associating element X-Ray intensity characteristics to oxide concentration.
X-Ray fluorescence measures elements, but the results may directly correspond to the oxide forms of these elements when there is only one single form of oxide present in the sample. Figures 1 -10 exhibit the calibration curves acquired for NiO, MgO, Al2O3, CaO, Cr2O3, Fe2O3, K2O, MnO, SiO2 and TiO2, respectfully.

Figure 1. NiO Calibration Graph. Thermo Fisher Scientific – Materials & Structural Analysis

Figure 2. MgO Calibration Graph. Thermo Fisher Scientific – Materials & Structural Analysis

Figure 3. Al2O3 Calibration Graph. Thermo Fisher Scientific – Materials & Structural Analysis

Figure 4. SiO2 Calibration Graph. Thermo Fisher Scientific – Materials & Structural Analysis

Figure 5. K2O Calibration Graph. Thermo Fisher Scientific – Materials & Structural Analysis

Figure 6. CaO Calibration Graph. Thermo Fisher Scientific – Materials & Structural Analysis

Figure 7. TiO2 Calibration Graph. Thermo Fisher Scientific – Materials & Structural Analysis

Figure 8. Cr2O3 Calibration Graph. Thermo Fisher Scientific – Materials & Structural Analysis

Figure 9. MnO Calibration Graph. Thermo Fisher Scientific – Materials & Structural Analysis
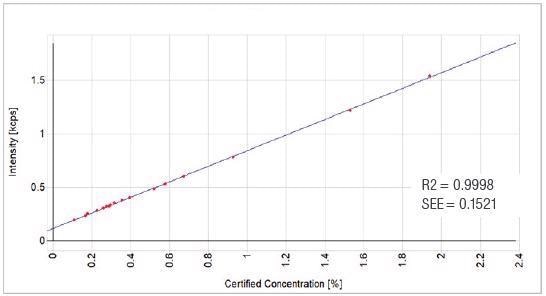
Figure 10. Fe2O3 Calibration Graph. Thermo Fisher Scientific – Materials & Structural Analysis
Validation
To validate the calibration values, three Nickel Ore reference materials (181, 184 and 198) were used.
Table 6 exhibits the results of the analysis for each of these reference materials. CRM reference values are contrasted against the average of 10 replicate analyses of the three CRMs, while Tables 3-5 demonstrates how repeatable each of the 10 replicates is relating to each CRM.
Table 3. Repeatability results of Nickel Ore using ARL OPTIM’X Spectrometer for sample 181. Source: Thermo Fisher Scientific – Materials & Structural Analysis
| Sample 181– all values are % |
| Elements |
Al2O3 |
CaO |
Co3O4 |
Cr2O3 |
Fe2O3 |
K2O |
MgO |
MnO |
NiO |
P2O5 |
SO3 |
SiO2 |
TiO2 |
ZnO |
| Rep 1 |
11.65 |
2.37 |
0.060 |
1.26 |
35.71 |
0.129 |
2.07 |
0.164 |
0.664 |
0.034 |
0.184 |
33.52 |
0.320 |
0.009 |
| Rep 2 |
11.33 |
2.37 |
0.060 |
1.26 |
35.70 |
0.133 |
2.04 |
0.168 |
0.669 |
0.039 |
0.173 |
33.48 |
0.326 |
0.009 |
| Rep 3 |
11.56 |
2.37 |
0.061 |
1.25 |
35.57 |
0.131 |
2.16 |
0.169 |
0.658 |
0.031 |
0.181 |
33.40 |
0.341 |
0.009 |
| Rep 4 |
11.46 |
2.36 |
0.064 |
1.24 |
35.61 |
0.139 |
2.07 |
0.169 |
0.657 |
0.026 |
0.211 |
33.50 |
0.330 |
0.010 |
| Rep 5 |
11.49 |
2.36 |
0.059 |
1.25 |
35.65 |
0.132 |
2.14 |
0.169 |
0.661 |
0.032 |
0.191 |
33.35 |
0.329 |
0.012 |
| Rep 6 |
11.57 |
2.35 |
0.060 |
1.25 |
35.68 |
0.138 |
2.07 |
0.165 |
0.658 |
0.026 |
0.166 |
33.66 |
0.333 |
0.007 |
| Rep 7 |
11.37 |
2.35 |
0.059 |
1.26 |
35.62 |
0.130 |
2.05 |
0.163 |
0.666 |
0.035 |
0.184 |
33.73 |
0.326 |
0.011 |
| Rep 8 |
11.31 |
2.35 |
0.062 |
1.27 |
35.70 |
0.128 |
2.02 |
0.168 |
0.666 |
0.021 |
0.207 |
33.62 |
0.336 |
0.010 |
| Rep 9 |
11.63 |
2.39 |
0.059 |
1.26 |
35.68 |
0.126 |
2.05 |
0.166 |
0.664 |
0.027 |
0.180 |
33.51 |
0.343 |
0.009 |
| Rep 10 |
11.59 |
2.35 |
0.061 |
1.26 |
35.69 |
0.132 |
2.11 |
0.168 |
0.656 |
0.028 |
0.170 |
33.43 |
0.335 |
0.014 |
| AVG |
11.50 |
2.36 |
0.060 |
1.26 |
35.66 |
0.132 |
2.08 |
0.167 |
0.662 |
0.030 |
0.185 |
33.52 |
0.332 |
0.010 |
| SD |
0.124 |
0.013 |
0.002 |
0.008 |
0.047 |
0.004 |
0.045 |
0.002 |
0.005 |
0.005 |
0.015 |
0.119 |
0.007 |
0.002 |
Table 4. Repeatability results of Nickel Ore using ARL OPTIM’X Spectrometer for sample 184. Source: Thermo Fisher Scientific – Materials & Structural Analysis
| Sample 184 – all values are % |
| Elements |
Al2O3 |
CaO |
Co3O4 |
Cr2O3 |
Fe2O3 |
K2O |
MgO |
MnO |
NiO |
P2O5 |
SO3 |
SiO2 |
TiO2 |
ZnO |
| Rep 1 |
4.58 |
0.215 |
0.121 |
1.760 |
39.14 |
0.011 |
3.04 |
0.667 |
1.280 |
0.036 |
0.032 |
42.22 |
0.055 |
0.033 |
| Rep 2 |
4.47 |
0.211 |
0.121 |
1.760 |
39.20 |
0.011 |
2.92 |
0.670 |
1.290 |
0.033 |
0.037 |
42.35 |
0.071 |
0.033 |
| Rep 3 |
4.51 |
0.216 |
0.120 |
1.770 |
39.22 |
0.012 |
3.07 |
0.666 |
1.290 |
0.030 |
0.043 |
42.41 |
0.062 |
0.033 |
| Rep 4 |
4.53 |
0.216 |
0.121 |
1.760 |
39.20 |
0.011 |
3.11 |
0.665 |
1.290 |
0.045 |
0.042 |
42.27 |
0.062 |
0.028 |
| Rep 5 |
4.49 |
0.218 |
0.121 |
1.770 |
39.27 |
0.012 |
3.06 |
0.674 |
1.290 |
0.050 |
0.050 |
42.62 |
0.059 |
0.032 |
| Rep 6 |
4.58 |
0.209 |
0.120 |
1.760 |
39.12 |
0.010 |
3.07 |
0.660 |
1.280 |
0.045 |
0.032 |
42.64 |
0.066 |
0.034 |
| Rep 7 |
4.48 |
0.214 |
0.124 |
1.750 |
39.09 |
0.014 |
3.15 |
0.667 |
1.300 |
0.038 |
0.031 |
42.32 |
0.058 |
0.034 |
| Rep 8 |
4.60 |
0.217 |
0.124 |
1.750 |
39.13 |
0.009 |
3.05 |
0.666 |
1.290 |
0.040 |
0.049 |
42.51 |
0.065 |
0.031 |
| Rep 9 |
4.50 |
0.224 |
0.120 |
1.780 |
39.27 |
0.014 |
3.02 |
0.657 |
1.290 |
0.031 |
0.056 |
42.26 |
0.066 |
0.031 |
| Rep 10 |
4.42 |
0.228 |
0.125 |
1.760 |
39.14 |
0.012 |
3.05 |
0.674 |
1.300 |
0.032 |
0.061 |
42.37 |
0.059 |
0.030 |
| AVG |
4.51 |
0.217 |
0.122 |
1.760 |
39.18 |
0.012 |
3.05 |
0.667 |
1.290 |
0.038 |
0.043 |
42.40 |
0.062 |
0.032 |
| SD |
0.057 |
0.006 |
0.002 |
0.009 |
0.063 |
0.001 |
0.060 |
0.005 |
0.007 |
0.007 |
0.010 |
0.148 |
0.005 |
0.002 |
Table 5. Repeatability results of Nickel Ore using ARL OPTIM’X Spectrometer for sample 198. Source: Thermo Fisher Scientific – Materials & Structural Analysis
| Sample 198– all values are % |
| Elements |
Al2O3 |
CaO |
Co3O4 |
Cr2O3 |
Fe2O3 |
K2O |
MgO |
MnO |
NiO |
P2O5 |
SO3 |
SiO2 |
TiO2 |
ZnO |
| Rep 1 |
15.75 |
0.350 |
0.106 |
0.285 |
46.18 |
0.100 |
0.807 |
1.53 |
0.085 |
0.167 |
0.105 |
22.83 |
1.35 |
0.022 |
| Rep 2 |
15.74 |
0.345 |
0.106 |
0.281 |
46.15 |
0.099 |
0.841 |
1.51 |
0.088 |
0.170 |
0.115 |
23.04 |
1.36 |
0.022 |
| Rep 3 |
15.83 |
0.348 |
0.109 |
0.281 |
46.08 |
0.098 |
0.808 |
1.52 |
0.081 |
0.179 |
0.124 |
22.84 |
1.37 |
0.024 |
| Rep 4 |
15.79 |
0.357 |
0.106 |
0.269 |
46.09 |
0.103 |
0.820 |
1.51 |
0.090 |
0.179 |
0.119 |
22.91 |
1.36 |
0.021 |
| Rep 5 |
15.89 |
0.368 |
0.105 |
0.271 |
46.07 |
0.106 |
0.882 |
1.52 |
0.086 |
0.179 |
0.132 |
23.05 |
1.36 |
0.020 |
| Rep 6 |
15.72 |
0.349 |
0.108 |
0.273 |
46.12 |
0.100 |
0.829 |
1.52 |
0.091 |
0.170 |
0.132 |
22.89 |
1.36 |
0.024 |
| Rep 7 |
15.67 |
0.357 |
0.112 |
0.279 |
46.18 |
0.101 |
0.797 |
1.51 |
0.092 |
0.179 |
0.128 |
22.85 |
1.36 |
0.023 |
| Rep 8 |
15.88 |
0.342 |
0.109 |
0.281 |
46.01 |
0.099 |
0.870 |
1.51 |
0.088 |
0.171 |
0.119 |
22.90 |
1.38 |
0.024 |
| Rep 9 |
15.90 |
0.355 |
0.111 |
0.283 |
46.04 |
0.107 |
0.861 |
1.51 |
0.089 |
0.186 |
0.117 |
23.01 |
1.36 |
0.026 |
| Rep 10 |
15.65 |
0.345 |
0.112 |
0.275 |
46.22 |
0.106 |
0.817 |
1.51 |
0.089 |
0.172 |
0.126 |
23.13 |
1.37 |
0.024 |
| AVG |
15.78 |
0.352 |
0.108 |
0.278 |
46.11 |
0.102 |
0.833 |
1.51 |
0.088 |
0.175 |
0.122 |
22.95 |
1.36 |
0.023 |
| SD |
0.091 |
0.008 |
0.003 |
0.005 |
0.068 |
0.003 |
0.029 |
0.007 |
0.003 |
0.006 |
0.008 |
0.104 |
0.008 |
0.002 |
Table 6. Analysis results of Nickel Ore using ARL OPTIM’X Spectrometer. Source: Thermo Fisher Scientific – Materials & Structural Analysis
| Element |
Sample 181 |
Sample 184 |
Sample 198 |
| CRM |
AVG |
Difference |
CRM |
AVG |
Difference |
CRM |
AVG |
Difference |
| Al2O3 |
11.55 |
11.50 |
0.050 |
4.622 |
4.510 |
0.112 |
15.81 |
15.78 |
0.030 |
| CaO |
2.372 |
2.360 |
0.012 |
0.216 |
0.217 |
-0.001 |
0.346 |
0.352 |
-0.006 |
| Cr2O3 |
0.061 |
0.060 |
0.001 |
0.123 |
0.122 |
0.001 |
0.110 |
0.108 |
0.002 |
| Fe2O3 |
1.241 |
1.260 |
-0.019 |
1.75 |
1.76 |
-0.010 |
0.285 |
0.278 |
0.007 |
| K2O |
35.944 |
35.66 |
0.284 |
39.298 |
39.180 |
0.118 |
45.99 |
46.11 |
-0.120 |
| MgO |
0.132 |
0.132 |
0.000 |
NA |
NA |
NA |
0.101 |
0.102 |
-0.001 |
| MnO |
2.054 |
2.08 |
-0.026 |
3.045 |
3.050 |
-0.005 |
0.798 |
0.833 |
-0.035 |
| NiO |
0.168 |
0.167 |
0.001 |
0.676 |
0.667 |
0.009 |
1.53 |
1.51 |
0.020 |
| SiO2 |
0.652 |
0.662 |
-0.010 |
1.295 |
1.290 |
0.005 |
0.088 |
0.088 |
0.000 |
| TiO2 |
0.017 |
0.030 |
-0.013 |
0.017 |
0.038 |
-0.021 |
0.161 |
0.175 |
-0.014 |
| Co3O4 |
0.189 |
0.185 |
0.004 |
0.060 |
0.043 |
0.017 |
NA |
NA |
NA |
| P2O5 |
33.785 |
33.52 |
0.265 |
42.252 |
42.400 |
-0.148 |
22.79 |
22.95 |
-0.160 |
| SO3 |
0.339 |
0.332 |
0.007 |
NA |
NA |
NA |
1.36 |
1.36 |
0.000 |
| ZnO |
0.012 |
0.010 |
0.002 |
0.035 |
0.032 |
0.003 |
0.026 |
0.023 |
0.003 |
Conclusion
This article outlines the aptitude of the ARL OPTIM’X spectrometer for the accurate analysis of nickel ore samples. This instrument facilitates reliable and rapid analysis results in combination with exceptional repeatability in a compact housing.
An overall analysis time of 10.4 minutes was employed with the ARL OPTIM’X at 50 W power. Measurement time can be calibrated further in line with each specific application.
All counting time may be reduced by a factor of 2.5 when the 200 W version of ARL OPTIM’X is used and accomplishes equivalent accuracy and precision. Thus, the overall analysis time required would decrease to around 4 minutes.

This information has been sourced, reviewed and adapted from materials provided by Thermo Fisher Scientific – Materials & Structural Analysis.
For more information on this source, please visit Thermo Fisher Scientific – Materials & Structural Analysis.