Quantitative analysis of volatile nitrosamine impurities in drug products is greatly simplified using SIFT-MS and has a three-fold throughput advantage (excluding sample prep benefits) over chromatographic methods.
The known or suspected mutagenicity of various N-nitrosamines – particularly, N-nitrosodimethylamine (NDMA) and N-nitrosodiethylamine (NDEA) – means their presence in any product to which humans are exposed is of concern. Even though these compounds are often found in beverages, water and foods, their discovery in sartan medicines in 2018 took the pharmaceutical industry by surprise.1
Elastomeric sources of N-nitrosamines – typically used in various packaging components – are controlled stringently due to recent improvements rolled out in the manufacture of elastomers as a response to historic issues across the industry.2
Investigations have shown that the majority of N-nitrosamine issues originate from nitrosating agents used in synthesis – especially when the presence of secondary amines is detected.3
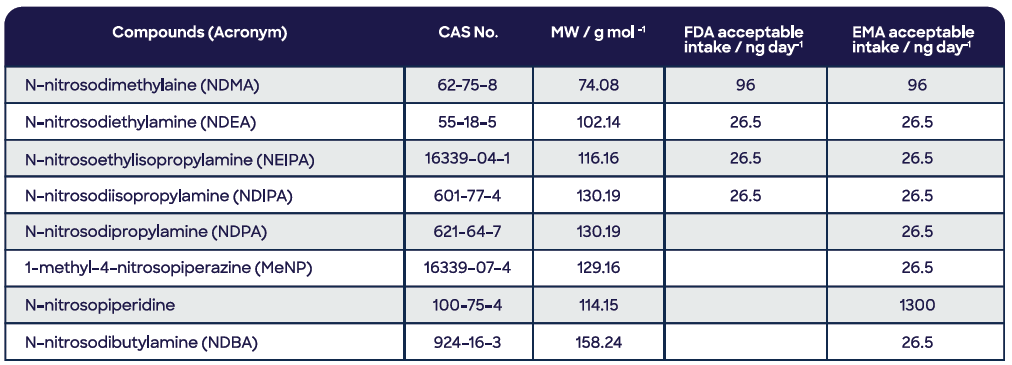
Following considerable industry investigation and consultation, the European Medicines Agency (EMA) and the United States Food and Drug Administration (FDA) have published suitable intakes.4 The limits for the more volatile N-nitrosamines are detailed in Table 1.
Table 1. Volatile nitrosamines of concern to the United States FDA and EMA, with acceptable intakes for each regulatory agency. Source: Syft Technologies
With suitable intakes at low nanogram levels per day, highly sensitive and selective analytical methods are necessary. Generally, these are predicated on gas or liquid chromatography with prolonged analysis times and increasingly complex sample preparation (e.g., dissolution and centrifugation needed).
They are also off-line methods, which take a comparatively long time to result for the first sample when considering calibration and a relatively low sample throughput overall.
Conversely, selected ion flow tube mass spectrometry (SIFT-MS) significantly streamlines the sample preparation process (drug product is weighed into the vial). It removes the need to perform the slow chromatography step by directly applying soft chemical ionization to gas-phase and headspace samples.
This approach not only accelerates analysis times but can also considerably reduce other sample preparation because no derivatization of the highly polar nitrosamines is necessary.5
This article describes how headspace SIFT-MS is well-suited to quantitative screening analysis of volatile nitrosamines in drug products due to its highly sensitive and selective nature. It also offers a number of considerable advantages over routine chromatographic analysis through the rapid capture of results and greater sample throughputs (Figure 1).
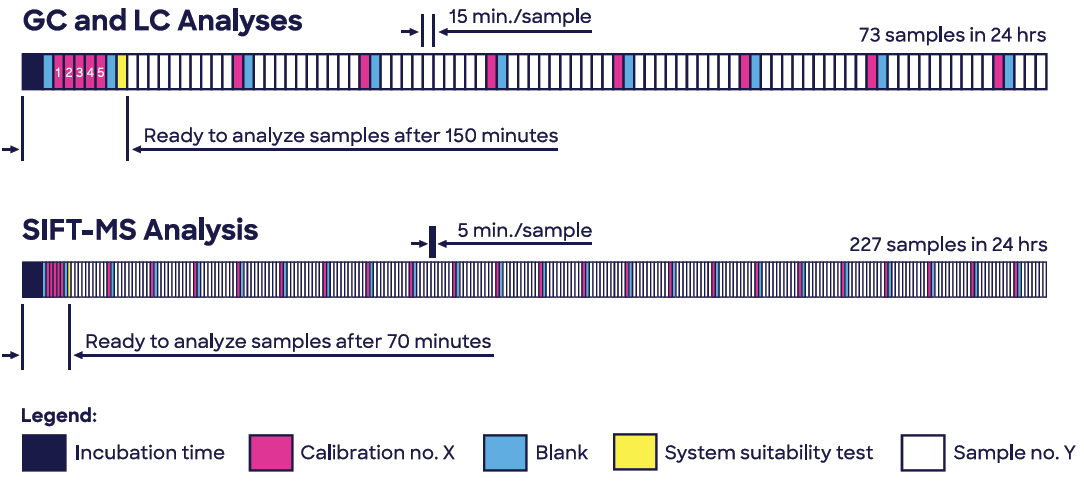
Figure 1. Headspace SIFT-MS enables high-throughput screening of volatile nitrosamines, providing enhanced quality control and quality assurance. Image Credit: Syft Technologies
Method
1. The SIFT-MS Technique
For the duration of this study, a Syft Technologies Voice200ultra SIFT-MS instrument was used, which operated on helium carrier gas. SIFT-MS (Figure 2) utilizes soft chemical ionization (CI) to produce mass-selected reagent ions that can quickly react with and quantify volatile organic compounds (VOCs) down to part-per-trillion concentrations (by volume, pptV).6
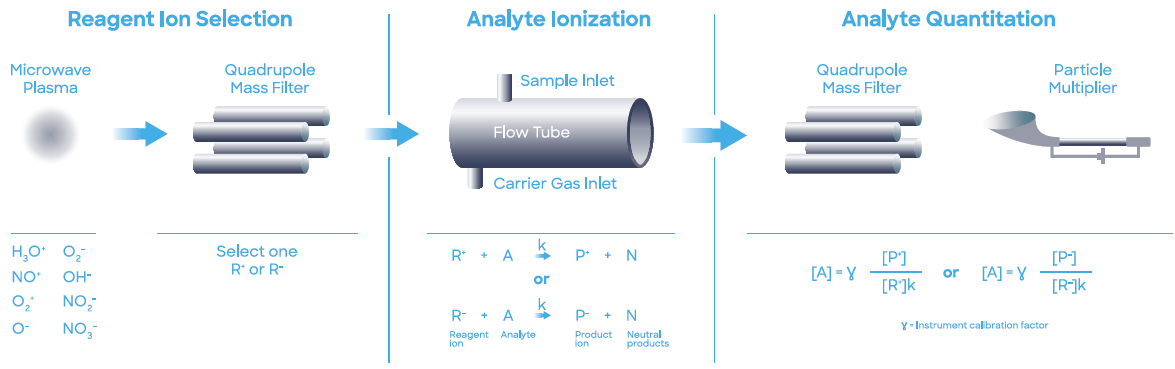
Figure 2. Schematic diagram of SIFT-MS – a direct, chemical-ionization analytical technique. Image Credit: Syft Technologies
Up to eight reagent ions (H3O+, NO+, O2+, O-, OH-, O2-, NO2- and NO3- ) acquired from a microwave discharge in air are incorporated into commercial SIFT-MS instruments.7
These reagent ions do not react with the major components of air (N2, O2, and Ar) but effectively respond to VOCs and other trace analytes in well-controlled ion-molecule reactions. This facilitates direct, real-time analysis of air samples at trace and ultra-trace levels without the need for pre-concentration.
High-speed switching between reagent ions offers excellent selectivity because the multiple reaction mechanisms provide independent measurements relative to each analyte. The multiple reagent ions frequently eliminate uncertainty from isobaric overlaps in mixtures that contain multiple analytes.
Automated MHE analysis was performed utilizing a SIFT-MS instrument paired with a multipurpose autosampler (MPS Robotic Pro, GERSTEL; Mülheim, Germany). GERSTEL’s Maestro software was used to control the autosampler. Samples were incubated in a GERSTEL agitator for 30 minutes at 60 °C.
Headspace was sampled using a 2.5 mL headspace syringe (heated to 150 °C) and then injected at a flow rate of 100 μL s-1 into the SIFT-MS instrument’s autosampler inlet (heated to 150 °C) through a self-sealing GERSTEL septumless sampling head.
As the nominal sample flow into the SIFT-MS instrument is 370 µL s-1, a make-up gas flow (ultra-high purity nitrogen) is also introduced through the sampling head. This dilution is taken into account in the calibration curve, which was produced under the same conditions as the samples were measured.
Each sample was subjected to an analysis time of 100 seconds (Figure 3) and reported concentrations are the average of the values acquired during injection (i.e., between ca. 40 and 60 seconds). It is important to note that no internal standard was applied.8
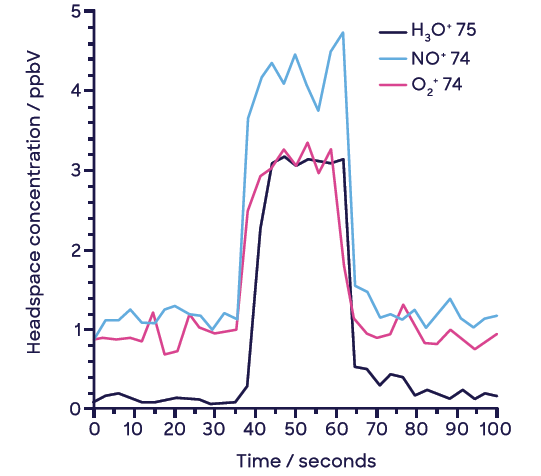
Figure 3. Example headspace injection with synchronous SIFT-MS analysis of NDMA at 2.6-ng spike level (10-mL sample vial). Image Credit: Syft Technologies
2. SIFT-MS Analysis of NDMA and Matrix Effects
Details regarding SIFT-MS analysis applied to a variety of volatile nitrosamines have been published.9 Table 2 outlines the reaction chemistry for NDMA, the target analyte, during the study. Reaction rate coefficients, k, are the predominant measure of SIFT-MS sensitivity and are greater for nitrosamines than for the majority of VOCs due to their high polarity.
Table 2. SIFT-MS reaction chemistry (rate coefficient (k), product ion formulae, branching ratio (BR as %), and mass-to-charge ratio (m/z)) for NDMA and N,N-dimethylformamide (DMF), a potential interferent. Ions in gray are not ordinarily used for quantitation or identification due to their low BR (reduced sensitivity). Source: Syft Technologies
Selectivity is achieved as a result of the availability of numerous product ions per compound, which facilitates the cross-comparison of independent concentration measurements from the singular product ions. N, N-Dimethylformamide (DMF) has been introduced because it is the most likely interferent for NDMA through its 13C isotope peak.
This interference, when it is seen, can be remedied through subtraction from the apparent NDMA signal. This correction was accounted for in the concentration data presented in this article.
Besides potential interference by DMF, raised levels of residual solvent also tend to have a bearing on the calculation of concentrations in SIFT-MS due to excessive consumption of reagent ions. High concentrations are seen in the non-linear responses to drug product mass for H3O+ and O2+; this phenomenon must be understood and compensated for in method development.
Here, the NO+ reagent is typically more resilient to this effect compared to H3O+ and O2+ due to it being somewhat less sensitive to commonly used solvents such as ethanol or isopropyl alcohol. Figure 4 displays a full scan analysis of one of the drug products with spectral features emerging from these solvents annotated.
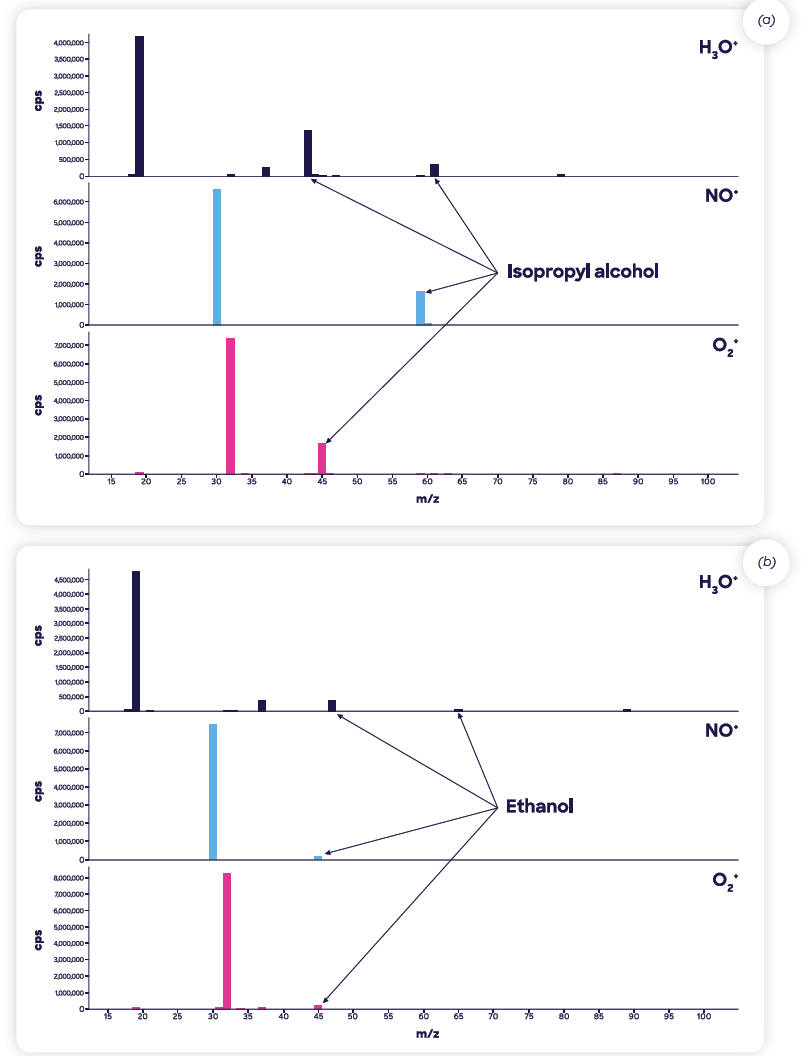
Figure 4. SIFT-MS full-scan mass spectra of the two ranitidine-containing drug products containing relatively high levels of residual solvents (a) isopropyl alcohol in Product 1 and (b) ethanol in Product 2. The largest spectral features peaks are from the reagent ions, H3O+ (m/z 19), NO+ (30), and O2 + (32). Image Credit: Syft Technologies
3. Drug Product Samples
The focus of this study was on the development of the method rather than subjecting a large number of drug samples to testing. Here, two commercial ranitidine products were assessed for NDMA content via analysis.
Powdered samples (100 to 500 mg) were introduced to 10 mL headspace vials for headspace analysis without ensuing dissolution in water (i.e., of the powder itself), which is known as “direct analysis”. This facilitated a reduction in the size of the headspace vial from the ‘standard’ recommended volume of 20 mL to enhance sensitivity.9
Results and Discussion
Two studies are presented in this section: firstly, the evaluation of the quantitation of NDMA in the gas phase using headspace-SIFT-MS. The second is a demonstration of quantitative analysis of NDMA in ranitidine products.
1. NDMA Detection Linearity and LOQ
First, when developing the method, it was necessary to confirm the linear detection of NDMA and acquire an estimated LOQ for headspace analysis.
The two data sets in Figure 5 were created by serial dilution of fully evaporated NDMA solutions. The increased range on the left is the result of full evaporation of 1 μL of commercial NDMA standard (5 mg mL-1 in methanol).
A 1 μL aliquot of the headspace was diluted in a nitrogen-filled 20 mL sample vial. From this, 250, 500, 750, 1000, and 1250 μL aliquots were inserted into five vials, providing the masses of NDMA displayed on the horizontal x-axis.
The lower range (Figure 5(b)) necessitated pre-dilution of the commercial methanolic standard in 50% acetone prior to creating the vapor-phase stock via a 0.5 μL spike into a 20 mL headspace vial – hence the four-fold dilution and then the various levels being generated.
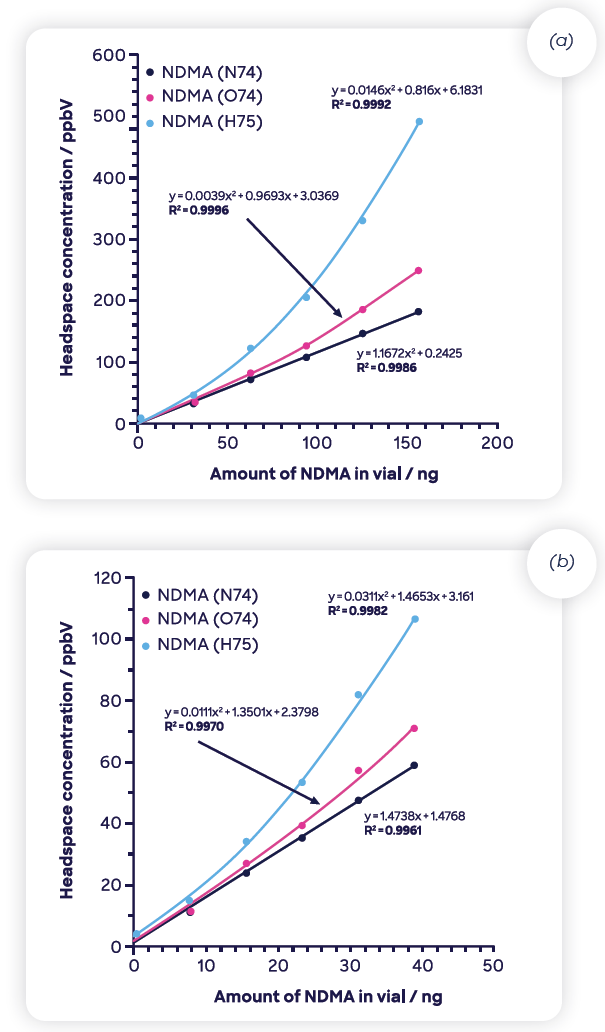
Figure 5. NDMA response in presence of (a) methanol and (b) 50:50 methanol:acetone mix. See the text for details on how these curves were created. Image Credit: Syft Technologies
All three ions targeted in the analysis of NDMA are displayed because they represent the second matrix effect detailed in the Methods section: the presence of solvents (methanol and methanol plus acetone).
It should be noted that for a dilutant, acetone was used in an attempt to stimulate the same non-linear response in NO+ since acetone reacts more rapidly with this reagent ion than it does with methanol, but the NO+ remained steadfast.
Although the solvents do not originate from a drug product but rather from the calibration mixture, the effect is the same. With a lack of chromatographic separation, they are present in the ionization region of the SIFT-MS instrument (the flow tube) and rival NDMA for the selected SIFT-MS reagent ion.
At the high concentration end of Figure 5(a), there is ca. 60 ppmV of methanol in the headspace. Methanol has no effect on NO+, but H3O+ (especially) and O2+ generate increasing over-reporting as the concentration increases.
As a result of this behavior, the NO+ product ion (m/z 74) is applied as the quantitation ion, while O2+ and H3O+ are referred to as qualifier ions. Figure 6 illustrates the combined range for the quantitation ion.
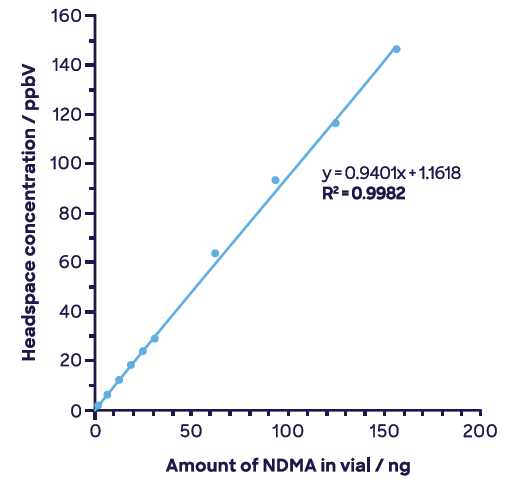
Figure 6. NDMA across full range showing just the quantitation ion, NO+ m/z 74. Image Credit: Syft Technologies
The signal-to-noise ratio (S/N), the limit of detection (LOD), and the limit of quantitation (LOQ) for gas-phase SIFT-MS analysis of NDMA are outlined in Table 3.
These are characteristic of the use of a 2.5 mL aliquot of headspace injected at 100 μL s-1 and were quantified using the low-concentration headspace injection displayed in Figure 3. From the data, the LOQ for drug products is estimated to be around 2 ng g-1 for a 500 mg sample.
Table 3. Signal-to-noise (S/N), limit of detection (LOD), and limit of quantitation (LOQ) for gas-phase SIFT-MS analysis of NDMA in a 2.5-mL aliquot injected at 100 μL s-1. Source: Syft Technologies
2. Quantitative Analysis of NDMA in Solid Drug Product
Multiple headspace extraction (MHE) facilitates the determination of absolute concentrations in condensed phases independent of the matrix.10 Hence for direct quantitative analysis of solid dose forms, it is considered to be a powerful technique as it prevents the introduction of any complicated matrix matching procedures.
Due to rapid sample analysis, the SIFT-MS technique makes this repeat-analysis methodology significantly more cost-effective, although the overall objective is not to run full MHE on all samples but to correlate the first injection with full MHE and apply a correction factor.11
Successful MHE demands analysis over a dynamic range of ca. two orders of magnitude; thus, the initial step requires optimization of the amount of sample that should be used from static headspace analysis (at equilibrium; see Figure 7). For NO+, signal levels indicate that 500 mg of drug product can be applied.
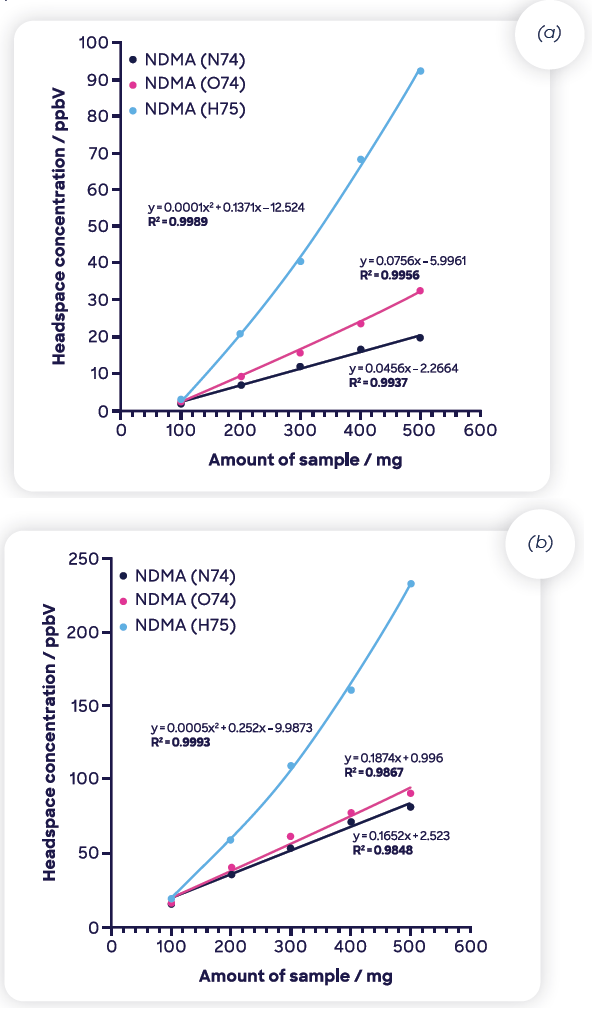
Figure 7. Measured headspace concentration of NDMA using SIFT-MS as a function of sample mass for two ranitidine drug products. Image Credit: Syft Technologies
Hence full MHE was conducted, with the results acquired over six injections plotted against the natural logarithm of concentration in Figure 8. It is clear to see that the ions in Product 1 (Figure 8(a)) do not behave linearly with injection number, while NO+ and O2+ behave well for Product 2.
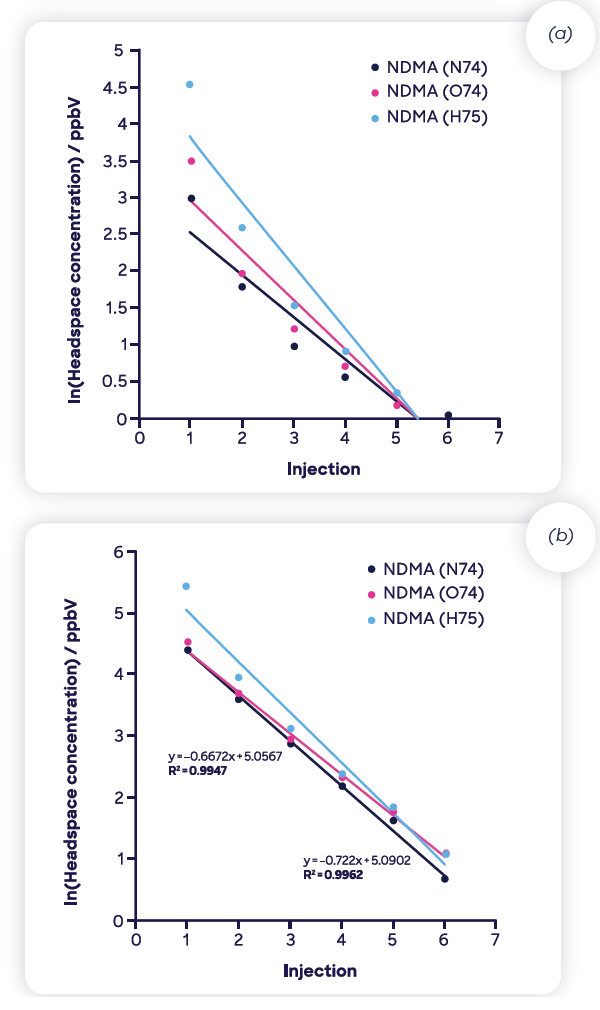
Figure 8. MHE-SIFT-MS results (natural logarithm of headspace concentration as function of injection number) for NDMA in 500-mg samples of two ranitidine drug products. Image Credit: Syft Technologies
Yet, under the incubation conditions applied, the NDMA concentration in both drug products is effectively at the baseline by the sixth injection. This indicates that even when it is not possible to adopt the traditional extrapolation approach to establishing total concentration in the drug product,12 the individual concentration measurements can still be totaled.
For Product 2, the traditional area-under-the-curve-approach was used to determine the final concentration, while for Product 1, the values acquired for injections 1 – 6 were added together.
The concentrations of NDMA in Products 1 and 2 are 68 and 328 ng g-1, respectively. These correspond to the range reported to the US FDA for ranitidine products.13 Full MHE-SIFT-MS offers a sample throughput of 40 samples per day with a 30-minute incubation,14 whereas only five samples per day can be run using MHE-GC analysis.
In spite of some of the MHE curves not behaving in a linear manner, the results are highly repeatable, as triplicate measurements acquired for 300 mg samples indicate (Figure 9).
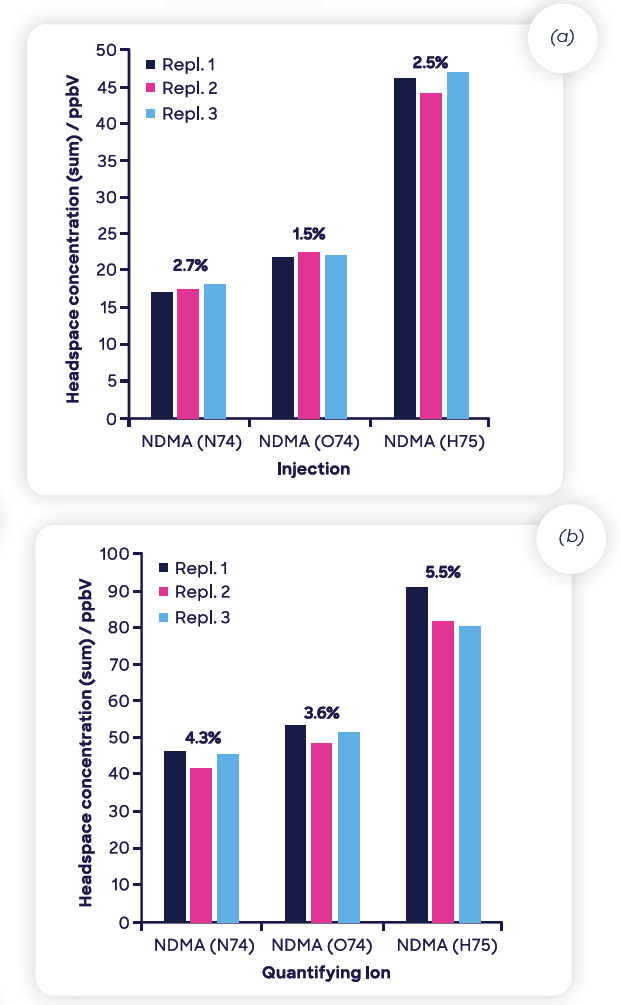
Figure 9. Repeatability of triplicate MHE-SIFT-MS measurements of NDMA (using NO+ 74) in 300-mg samples of the two ranitidine drug products. Image Credit: Syft Technologies
This data leveraged the entire six-injection MHE approach, and no internal standard was applied, as is standard practice with SIFT-MS. This indicates the excellent repeatability of the SIFT-MS technique, even when applied to non-ideal matrices.
This repeatability feature facilitates the use of a single headspace injection per sample as opposed to full MHE because the latter is repeatably related to the first injection, as shown during the MHE-SIFT-MS analysis of polystyrene.14
It should be noted that the sample must be at equilibrium. Figure 10 displays the correlation between the first injection and the sum of injections (1 to 6) for the repeatability data provided in Figure 9.
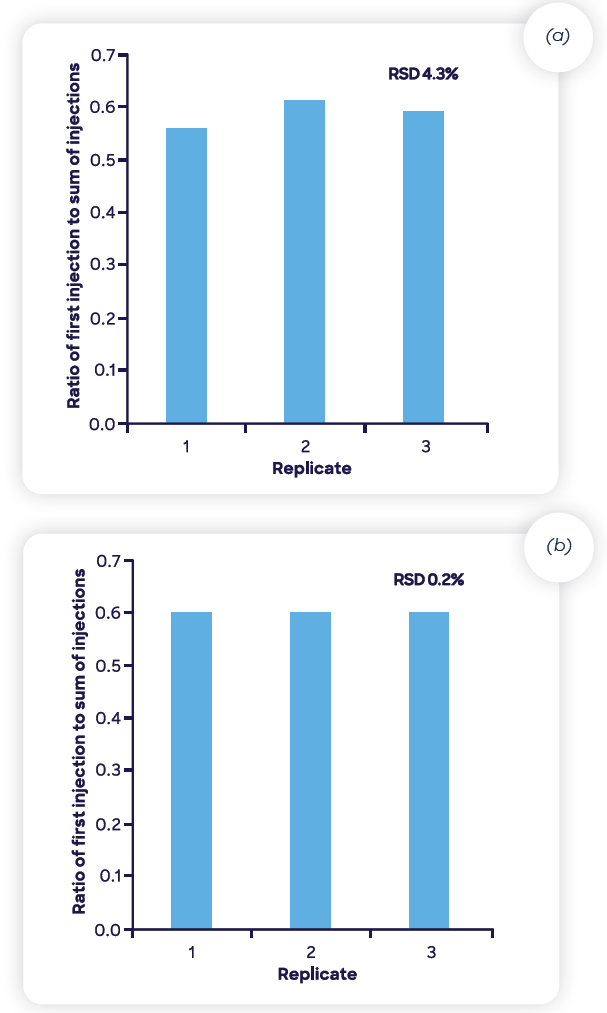
Figure 10. Repeatability of the ratio of first injection to the sum of all injections for the two ranitidine drug products shown in Figure 9. Image Credit: Syft Technologies
The replicates show exceptional repeatability, close to 0.6 of the total NDMA in the sample partitioning to the headspace in the initial 30-minute incubation cycle at 60 °C. This result indicates that over 250 samples can be screened per day for very low nanogram-per-gram quantities of NDMA with headspace-SIFT-MS.
This is ca. four-fold higher throughput than can be achieved using GC and LC with automated sample preparation or over six-fold higher for manual sample preparation.
Conclusions
A high-sensitivity headspace-SIFT-MS analysis can detect NDMA at the extremely low ng g-1 range. Resultingly, Headspace-SIFT-MS offers considerably improved time to result and greater throughputs when compared to traditional chromatographic methods.
It is possible to run quantitative analysis direct from solid/powder from a single incubation cycle through correlation with MHE-SIFT-MS.
Moreover, the method demonstrated simple sample preparation – as easy as adding powder to a vial and starting – as well as simple operation throughout. SIFT-MS analysis is an industry-proven technology fit for the QA/QC lab and process line.
References
- Hera D, Langford VS, McEwan MJ, McKellar TI, Milligan DB (2017). Negative reagent ions for real time detection using SIFT-MS. Environments 4, 16. DOI: 10.3390/environments4010016.
- Langford VS, Gray JDC, Maclagan RGAR, Milligan DB, McEwan MJ (2015). Real-time measurement of nitrosamines in air. Int. J. Mass Spectrom. 377, 490-495. DOI: 10.1016/j.ijms.2014.04.001.
- Perkins MJ, Langford VS (2021a). Application of routine analysis procedures to a direct mass spectrometry technique: selected ion flow tube mass spectrometry (SIFT-MS). Rev Sep Sci. 3, e21003. DOI: 10.17145/rss.21.003.
- Perkins MJ, Langford VS (2021b). Standard validation protocol for selected ion flow tube mass spectrometry methods applied to direct headspace analysis of aqueous volatile organic compounds. Anal Chem. 93, 8386-8392. DOI: 10.1021/ acs.analchem.1c01310.
- Perkins MJ, Langford VS (2022). Multiple Headspace Extraction- [SIFT-MS]. Part 1: A Protocol for Method Development and Transfer to Routine Analysis. Rev Sep Sci. 4(1), e22001. DOI: 10.17145/rss.22.001.
- Smith D, McEwan MJ, Španěl P (2020). Understanding gas phase ion chemistry is the key to reliable selected ion flow tube-mass spectrometry analyses. Anal. Chem. 92, 12750- 12762. DOI: 10.1021/acs.analchem.0c03050.
- Golob N, Grahek R, Ross M, Roskar R (2022) Nitrocellulose blister material as a source of N-nitrosamine contamination of pharmaceutical drug products. Int. J. Pharmaceutics 618, 121687. DOI: 10.1016/j.ijpharm.2022.121687.
- Boltres B (2021). Evaluating nitrosamines from elastomers in pharmaceutical primary packaging. PDA J. Pharm. Sci. Tech. July, pdajpst.2021.012645. DOI:10.5731/pdajpst.2021.012645.
- EMA (2021). Questions and answers for marketing authorisation holders/applicants on the CHMP Opinion for the Article 5(3) of Regulation (EC) No 726/2004 referral on nitrosamine impurities in human medicinal products, EMA/409815/2020. https://www.ema.europa.eu/en. (Accessed September 15, 2022.)
- US FDA (2019). Laboratory Tests | Ranitidine. https://www.fda. gov/drugs/drug-safety-and-availability/laboratory-testsranitidine (Accessed September 28, 2022.)
- US FDA (2021). Guidance for Industry. Control of Nitrosamine Impurities in Human Drugs. https://www.fda.gov/media/141720/download. (Accessed September 15, 2022.)

This information has been sourced, reviewed and adapted from materials provided by Syft Technologies.
For more information on this source, please visit Syft Technologies.