Two very different ores, lateritic and sulfidic, are used in nickel production. Lateritic ore is seen in tropical countries, such as Indonesia, and is mined from several depths below the surface, while sulfidic ore is generally found with copper ore and mined underground.
In the past few years, nickel production has witnessed a high demand; it is a major component in lithium-ion batteries and is utilized in electric vehicles. Therefore, a quick, precise, and accurate technique is required for quantifying such ores in the refining and mining processes.
X-Ray fluorescence spectrometry (XRF) is considered a well-established analytical technique to identify chemical composition in materials exhibiting high precision and the least sample preparation. It is a favored method in process and quality control throughout several industries.
Instrumentation
The Thermo Scientific™ ARL OPTIM’X™ WDXRF Spectrometer has been developed for easy use with the least operation and maintenance charges. The instrument is equipped with a Thermo Scientific SmartGonio™ Goniometer spanning elements from fluorine (9F) to uranium (92U). Two power versions exist, either 50 W or the new 200 W version. The 50 W version has been utilized for the tests displayed in this report.
The instrument does not need internal or external water cooling and executes 10 times better spectral resolution compared to a conventional EDXRF instrument as well as excellent stability and accuracy. It displays good performance for magnesium (12Mg), sodium (11Na), and fluorine (9F).
Analytical Conditions
As displayed in Table 1, spectra were gathered from every nickel ore sample for a complete analysis time of just 10.4 minutes with the help of the ARL OPTIM’X WDXRF Spectrometer at 50 W power. Measurement time could be further fine-tuned as per the particular applications.
All counting time can be reduced by a factor of 2.5 using the 200 W version of the ARL OPTIM’X WDXRF Spectrometer while still enabling the same precision and accuracy. Therefore, a complete analysis time would reduce to around four minutes
Table 1. Analytical conditions. Source: Thermo Fisher Scientific - Elemental Analyzers and Phase Analyzers
| Name |
Component type |
Analysis |
| time(s) |
kV |
mA |
| Ni Ka 1,2 |
Gonio XRF |
36 |
30 |
1.67 |
| Zn Ka 1,2 |
Gonio XRF |
60 |
30 |
1.67 |
| Cr Ka 1,2 |
Gonio XRF |
36 |
30 |
1.67 |
| Ti Ka 1,2 |
Gonio XRF |
36 |
30 |
1.67 |
| Si Ka 1,2 |
Gonio XRF |
36 |
30 |
1.67 |
| S Ka 1,2 |
Gonio XRF |
36 |
30 |
1.67 |
| P Ka 1,2 |
Gonio XRF |
60 |
30 |
1.67 |
| Mg Ka 1,2 |
Gonio XRF |
60 |
30 |
1.67 |
| K Ka 1,2 |
Gonio XRF |
60 |
30 |
1.67 |
| Ca Ka 1,2 |
Gonio XRF |
36 |
30 |
1.67 |
| Al Ka 1,2 |
Gonio XRF |
36 |
30 |
1.67 |
| Mn Ka 1,2 |
Gonio XRF |
36 |
30 |
1.67 |
| Co Ka 1,2 |
Gonio XRF |
60 |
30 |
1.67 |
| Fe Ka 1,2 |
Gonio XRF |
36 |
30 |
1.67 |
Sample Preparation
Calibration was carried out with the 18 nickel ore CRMs. Samples were made to fuse into beads in the absence of ignition with a sample-to-flux ratio of 1:20. Ammonium nitrate oxidizer was added to the fusion mix.
Table 2 displays the concentration ranges of the various oxides covered by the calibration. The R2 and SEE (standard error of estimate) values were achieved for the various compounds.
Table 2. Concentration ranges and calibration parameter values for the analysis of nickel ore. Source: Thermo Fisher Scientific - Elemental Analyzers and Phase Analyzers
| Elements |
Calibration |
R2 |
SEE |
| N |
Min % |
Max % |
| Al2O3 |
17 |
1.599 |
17.470 |
0.9998 |
0.0813 |
| CaO |
18 |
0.133 |
3.106 |
0.9999 |
0.0096 |
| Cr2O3 |
17 |
0.170 |
1.750 |
0.9980 |
0.0204 |
| Fe2O3 |
15 |
12.728 |
45.990 |
0.9998 |
0.1521 |
| K2O |
5 |
0.069 |
0.228 |
0.9831 |
0.0089 |
| MgO |
17 |
0.742 |
27.306 |
0.9998 |
0.1551 |
| MnO |
18 |
0.109 |
1.940 |
0.9996 |
0.0096 |
| NiO |
18 |
0.066 |
3.740 |
0.9996 |
0.0214 |
| SiO2 |
16 |
22.790 |
47.970 |
0.9993 |
0.2415 |
| TiO2 |
13 |
0.035 |
1.360 |
0.9998 |
0.0063 |
| Co3O4 |
16 |
0.031 |
0.123 |
0.9921 |
0.0027 |
| P2O5 |
7 |
0.005 |
0.173 |
0.9847 |
0.0099 |
| SO3 |
7 |
0.004 |
0.189 |
0.9763 |
0.0108 |
| ZnO |
18 |
0.009 |
0.044 |
0.9504 |
0.0023 |
Calibration
Calibration curves were derived relating element characteristic X-Ray intensities to oxide concentration. X-Ray fluorescence quantifies elements, but the outcomes could be directly related to the oxide forms of such elements when only one single form of oxide is present in the sample. Figures 1–10 display the calibration curves achieved for NiO, MgO, CaO, Al2O3, Cr2O3, MnO, Fe2O3, K2O, SiO2, and TiO2.
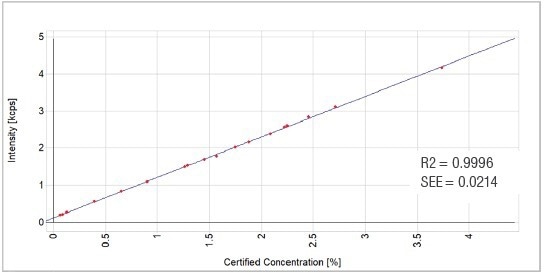
Figure 1. NiO calibration graph. Image Credit: Thermo Fisher Scientific - Elemental Analyzers and Phase Analyzers
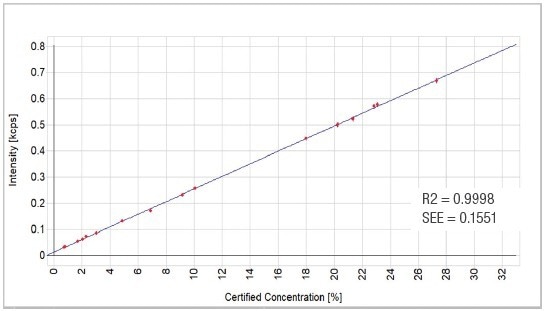
Figure 2. MgO calibration graph. Image Credit: Thermo Fisher Scientific - Elemental Analyzers and Phase Analyzers
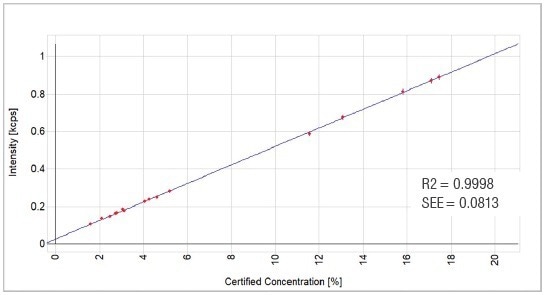
Figure 3. Al2O3 calibration graph. Image Credit: Thermo Fisher Scientific - Elemental Analyzers and Phase Analyzers
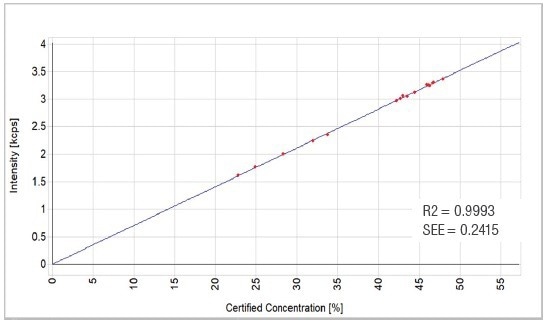
Figure 4. SiO2 calibration graph. Image Credit: Thermo Fisher Scientific - Elemental Analyzers and Phase Analyzers
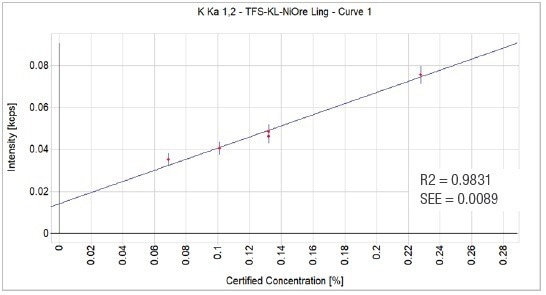
Figure 5. K2O calibration graph. Image Credit: Thermo Fisher Scientific - Elemental Analyzers and Phase Analyzers
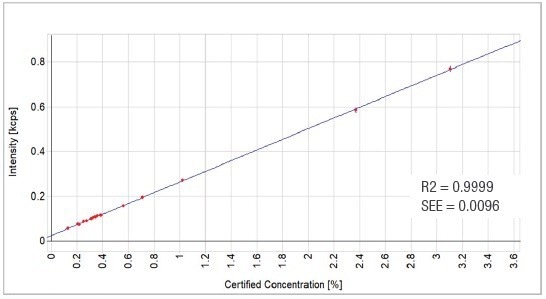
Figure 6. CaO calibration graph. Image Credit: Thermo Fisher Scientific - Elemental Analyzers and Phase Analyzers
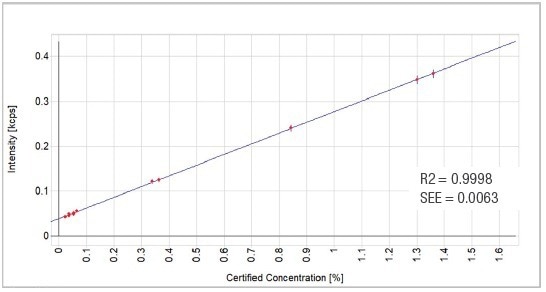
Figure 7. TiO2 calibration graph. Image Credit: Thermo Fisher Scientific - Elemental Analyzers and Phase Analyzers
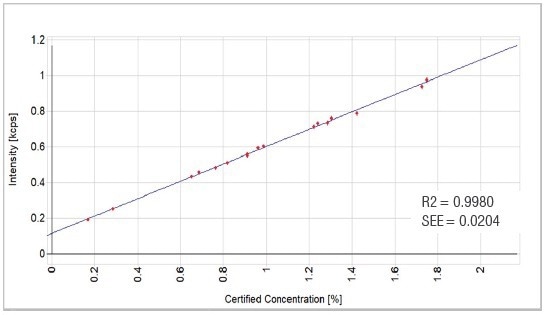
Figure 8. Cr2O3 calibration graph. Image Credit: Thermo Fisher Scientific - Elemental Analyzers and Phase Analyzers
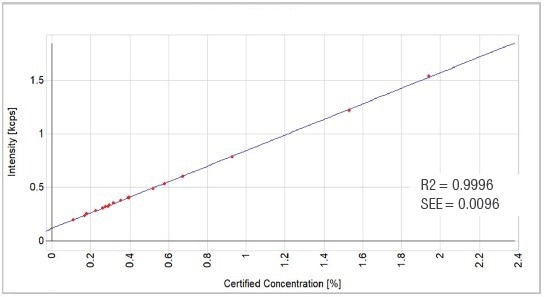
Figure 9. MnO calibration graph. Image Credit: Thermo Fisher Scientific - Elemental Analyzers and Phase Analyzers
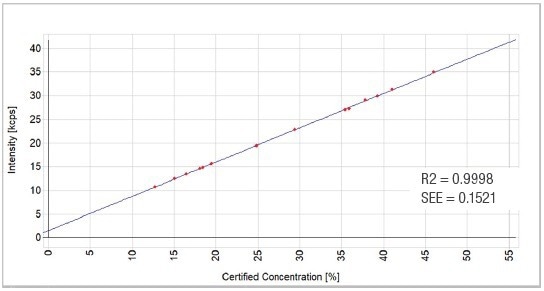
Figure 10. Fe2O3 calibration graph. Image Credit: Thermo Fisher Scientific - Elemental Analyzers and Phase Analyzers
Validation
To validate the calibration, three nickel ore reference materials (181, 184, and 198) were utilized. Table 6 displays the analysis outcomes for such reference materials. CRM reference values are compared with the average of 10 replicate analyses of the three CRMs, while Tables 3–5 display the repeatability of the 10 replicates for every CRM.
Table 3. Repeatability results of nickel ore using the ARL OPTIM’X WDXRF Spectrometer for sample 181. Source: Thermo Fisher Scientific - Elemental Analyzers and Phase Analyzers
| Elements |
Sample 181: all values are % |
| Al2O3 |
CaO |
Co3O4 |
Cr2O3 |
Fe2O3 |
K2O |
MgO |
MnO |
NiO |
P2O5 |
SO3 |
SiO2 |
TiO2 |
ZnO |
| Rep 1 |
11.65 |
2.37 |
0.060 |
1.26 |
35.71 |
0.129 |
2.07 |
0.164 |
0.664 |
0.034 |
0.184 |
33.52 |
0.320 |
0.009 |
| Rep 2 |
11.33 |
2.37 |
0.060 |
1.26 |
35.70 |
0.133 |
2.04 |
0.168 |
0.669 |
0.039 |
0.173 |
33.48 |
0.326 |
0.009 |
| Rep 3 |
11.56 |
2.37 |
0.061 |
1.25 |
35.57 |
0.131 |
2.16 |
0.169 |
0.658 |
0.031 |
0.181 |
33.40 |
0.341 |
0.009 |
| Rep 4 |
11.46 |
2.36 |
0.064 |
1.24 |
35.61 |
0.139 |
2.07 |
0.169 |
0.657 |
0.026 |
0.211 |
33.50 |
0.330 |
0.010 |
| Rep 5 |
11.49 |
2.36 |
0.059 |
1.25 |
35.65 |
0.132 |
2.14 |
0.169 |
0.661 |
0.032 |
0.191 |
33.35 |
0.329 |
0.012 |
| Rep 6 |
11.57 |
2.35 |
0.060 |
1.25 |
35.68 |
0.138 |
2.07 |
0.165 |
0.658 |
0.026 |
0.166 |
33.66 |
0.333 |
0.007 |
| Rep 7 |
11.37 |
2.35 |
0.059 |
1.26 |
35.62 |
0.130 |
2.05 |
0.163 |
0.666 |
0.035 |
0.184 |
33.73 |
0.326 |
0.011 |
| Rep 8 |
11.31 |
2.35 |
0.062 |
1.27 |
35.70 |
0.128 |
2.02 |
0.168 |
0.666 |
0.021 |
0.207 |
33.62 |
0.336 |
0.010 |
| Rep 9 |
11.63 |
2.39 |
0.059 |
1.26 |
35.68 |
0.126 |
2.05 |
0.166 |
0.664 |
0.027 |
0.180 |
33.51 |
0.343 |
0.009 |
| Rep 10 |
11.59 |
2.35 |
0.061 |
1.26 |
35.69 |
0.132 |
2.11 |
0.168 |
0.656 |
0.028 |
0.170 |
33.43 |
0.335 |
0.014 |
| AVG |
11.50 |
2.36 |
0.060 |
1.26 |
35.66 |
0.132 |
2.08 |
0.167 |
0.662 |
0.030 |
0.185 |
33.52 |
0.332 |
0.010 |
| SD |
0.124 |
0.013 |
0.002 |
0.008 |
0.047 |
0.004 |
0.045 |
0.002 |
0.005 |
0.005 |
0.015 |
0.119 |
0.007 |
0.002 |
Table 4. Repeatability results of nickel ore using the ARL OPTIM’X WDXRF Spectrometer for sample 184. Source: Thermo Fisher Scientific - Elemental Analyzers and Phase Analyzers
| Elements |
Sample 184: all values are % |
| Al2O3 |
CaO |
Co3O4 |
Cr2O3 |
Fe2O3 |
K2O |
MgO |
MnO |
NiO |
P2O5 |
SO3 |
SiO2 |
TiO2 |
ZnO |
| Rep 1 |
4.58 |
0.215 |
0.121 |
1.760 |
39.14 |
0.011 |
3.04 |
0.667 |
1.280 |
0.036 |
0.032 |
42.22 |
0.055 |
0.033 |
| Rep 2 |
4.47 |
0.211 |
0.121 |
1.760 |
39.20 |
0.011 |
2.92 |
0.670 |
1.290 |
0.033 |
0.037 |
42.35 |
0.071 |
0.033 |
| Rep 3 |
4.51 |
0.216 |
0.120 |
1.770 |
39.22 |
0.012 |
3.07 |
0.666 |
1.290 |
0.030 |
0.043 |
42.41 |
0.062 |
0.033 |
| Rep 4 |
4.53 |
0.216 |
0.121 |
1.760 |
39.20 |
0.011 |
3.11 |
0.665 |
1.290 |
0.045 |
0.042 |
42.27 |
0.062 |
0.028 |
| Rep 5 |
4.49 |
0.218 |
0.121 |
1.770 |
39.27 |
0.012 |
3.06 |
0.674 |
1.290 |
0.050 |
0.050 |
42.62 |
0.059 |
0.032 |
| Rep 6 |
4.58 |
0.209 |
0.120 |
1.760 |
39.12 |
0.010 |
3.07 |
0.660 |
1.280 |
0.045 |
0.032 |
42.64 |
0.066 |
0.034 |
| Rep 7 |
4.48 |
0.214 |
0.124 |
1.750 |
39.09 |
0.014 |
3.15 |
0.667 |
1.300 |
0.038 |
0.031 |
42.32 |
0.058 |
0.034 |
| Rep 8 |
4.60 |
0.217 |
0.124 |
1.750 |
39.13 |
0.009 |
3.05 |
0.666 |
1.290 |
0.040 |
0.049 |
42.51 |
0.065 |
0.031 |
| Rep 9 |
4.50 |
0.224 |
0.120 |
1.780 |
39.27 |
0.014 |
3.02 |
0.657 |
1.290 |
0.031 |
0.056 |
42.26 |
0.066 |
0.031 |
| Rep 10 |
4.42 |
0.228 |
0.125 |
1.760 |
39.14 |
0.012 |
3.05 |
0.674 |
1.300 |
0.032 |
0.061 |
42.37 |
0.059 |
0.030 |
| AVG |
4.51 |
0.217 |
0.122 |
1.760 |
39.18 |
0.012 |
3.05 |
0.667 |
1.290 |
0.038 |
0.043 |
42.40 |
0.062 |
0.032 |
| SD |
0.057 |
0.006 |
0.002 |
0.009 |
0.063 |
0.001 |
0.060 |
0.005 |
0.007 |
0.007 |
0.010 |
0.148 |
0.005 |
0.002 |
Table 5. Repeatability results of nickel ore using the ARL OPTIM’X WDXRF Spectrometer for sample 198. Source: Thermo Fisher Scientific - Elemental Analyzers and Phase Analyzers
| Elements |
Sample 198: all values are % |
| Al2O3 |
CaO |
Co3O4 |
Cr2O3 |
Fe2O3 |
K2O |
MgO |
MnO |
NiO |
P2O5 |
SO3 |
SiO2 |
TiO2 |
ZnO |
| Rep 1 |
15.75 |
0.350 |
0.106 |
0.285 |
46.18 |
0.100 |
0.807 |
1.53 |
0.085 |
0.167 |
0.105 |
22.83 |
1.35 |
0.022 |
| Rep 2 |
15.74 |
0.345 |
0.106 |
0.281 |
46.15 |
0.099 |
0.841 |
1.51 |
0.088 |
0.170 |
0.115 |
23.04 |
1.36 |
0.022 |
| Rep 3 |
15.83 |
0.348 |
0.109 |
0.281 |
46.08 |
0.098 |
0.808 |
1.52 |
0.081 |
0.179 |
0.124 |
22.84 |
1.37 |
0.024 |
| Rep 4 |
15.79 |
0.357 |
0.106 |
0.269 |
46.09 |
0.103 |
0.820 |
1.51 |
0.090 |
0.179 |
0.119 |
22.91 |
1.36 |
0.021 |
| Rep 5 |
15.89 |
0.368 |
0.105 |
0.271 |
46.07 |
0.106 |
0.882 |
1.52 |
0.086 |
0.179 |
0.132 |
23.05 |
1.36 |
0.020 |
| Rep 6 |
15.72 |
0.349 |
0.108 |
0.273 |
46.12 |
0.100 |
0.829 |
1.52 |
0.091 |
0.170 |
0.132 |
22.89 |
1.36 |
0.024 |
| Rep 7 |
15.67 |
0.357 |
0.112 |
0.279 |
46.18 |
0.101 |
0.797 |
1.51 |
0.092 |
0.179 |
0.128 |
22.85 |
1.36 |
0.023 |
| Rep 8 |
15.88 |
0.342 |
0.109 |
0.281 |
46.01 |
0.099 |
0.870 |
1.51 |
0.088 |
0.171 |
0.119 |
22.90 |
1.38 |
0.024 |
| Rep 9 |
15.90 |
0.355 |
0.111 |
0.283 |
46.04 |
0.107 |
0.861 |
1.51 |
0.089 |
0.186 |
0.117 |
23.01 |
1.36 |
0.026 |
| Rep 10 |
15.65 |
0.345 |
0.112 |
0.275 |
46.22 |
0.106 |
0.817 |
1.51 |
0.089 |
0.172 |
0.126 |
23.13 |
1.37 |
0.024 |
| AVG |
15.78 |
0.352 |
0.108 |
0.278 |
46.11 |
0.102 |
0.833 |
1.51 |
0.088 |
0.175 |
0.122 |
22.95 |
1.36 |
0.023 |
| SD |
0.091 |
0.008 |
0.003 |
0.005 |
0.068 |
0.003 |
0.029 |
0.007 |
0.003 |
0.006 |
0.008 |
0.104 |
0.008 |
0.002 |
Table 6. Analysis results of nickel ore using the ARL OPTIM’X WDXRF Spectrometer. Source: Thermo Fisher Scientific - Elemental Analyzers and Phase Analyzers
| Element |
Sample 181 |
Sample 184 |
Sample 198 |
| CRM |
AVG |
Difference |
CRM |
AVG |
Difference |
CRM |
AVG |
Difference |
| Al2O3 |
11.55 |
11.50 |
0.050 |
4.622 |
4.510 |
0.112 |
15.81 |
15.78 |
0.030 |
| CaO |
2.372 |
2.360 |
0.012 |
0.216 |
0.217 |
-0.001 |
0.346 |
0.352 |
-0.006 |
| Cr2O3 |
0.061 |
0.060 |
0.001 |
0.123 |
0.122 |
0.001 |
0.110 |
0.108 |
0.002 |
| Fe2O3 |
1.241 |
1.260 |
-0.019 |
1.75 |
1.76 |
-0.010 |
0.285 |
0.278 |
0.007 |
| K2O |
35.944 |
35.66 |
0.284 |
39.298 |
39.180 |
0.118 |
45.99 |
46.11 |
-0.120 |
| MgO |
0.132 |
0.132 |
0.000 |
NA |
NA |
NA |
0.101 |
0.102 |
-0.001 |
| MnO |
2.054 |
2.08 |
-0.026 |
3.045 |
3.050 |
-0.005 |
0.798 |
0.833 |
-0.035 |
| NiO |
0.168 |
0.167 |
0.001 |
0.676 |
0.667 |
0.009 |
1.53 |
1.51 |
0.020 |
| SiO2 |
0.652 |
0.662 |
-0.010 |
1.295 |
1.290 |
0.005 |
0.088 |
0.088 |
0.000 |
| TiO2 |
0.017 |
0.030 |
-0.013 |
0.017 |
0.038 |
-0.021 |
0.161 |
0.175 |
-0.014 |
| Co3O4 |
0.189 |
0.185 |
0.004 |
0.060 |
0.043 |
0.017 |
NA |
NA |
NA |
| P2O5 |
33.785 |
33.52 |
0.265 |
42.252 |
42.400 |
-0.148 |
22.79 |
22.95 |
-0.160 |
| SO3 |
0.339 |
0.332 |
0.007 |
NA |
NA |
NA |
1.36 |
1.36 |
0.000 |
| ZnO |
0.012 |
0.010 |
0.002 |
0.035 |
0.032 |
0.003 |
0.026 |
0.023 |
0.003 |
Conclusion
This article has reviewed the ARL OPTIM’X WDXRF Spectrometer's suitability for studying nickel ore samples. This compact instrument enables rapid and trustworthy analysis outcomes integrated with outstanding repeatability.
A complete analysis time of 10.4 minutes was utilized with the ARL OPTIM’X WDXRF Spectrometer at 50 W power. Measurement time could be fine-tuned as per specific applications.
All counting time could be reduced by a factor of 2.5 while utilizing the 200 W version of the ARL OPTIM'X WDXRF Spectrometer while still enabling the same precision and accuracy. In this context, the total analysis time would be around four minutes.

This information has been sourced, reviewed and adapted from materials provided by Thermo Fisher Scientific - Elemental Analyzers and Phase Analyzers.
For more information on this source, please visit Thermo Fisher Scientific - Elemental Analyzers and Phase Analyzers.