Photosensitive resin, also referred to as photoresist, is a material that exhibits a change in its properties upon exposure to ultraviolet light. This results in high-resolution microfabrication features, allowing for the formation of etching-resistant thin films in a short amount of time.
Photoresist finds extensive application in the manufacture of electronic parts, printed circuit board wiring, and print plate-making.
Short-time curing ultraviolet adhesives are utilized in a wide range of fields, including general and optical electronics, medical applications, glass arts, and architecture.
During the development of new photosensitive resins, curing reaction heat is a crucial characteristic that must be evaluated.
It is widely accepted that the conditions during light curing, such as the exposure wavelength, irradiation intensity, and reaction temperature, impact the formation of etching-resistant thin films. Therefore, it is necessary to consider various curing conditions to achieve the optimal etch-resistant thin film.
A differential scanning calorimeter (DSC) and a UV irradiation unit with a photochemical reaction differential calorimeter (PDC) can be used to measure curing reaction heat in real time when exposed to UV irradiation.
How Does Photochemical Reaction Differential Calorimeter (PDC) Work?
The PDC is employed in conjunction with a DSC, and it irradiates the sample with ultraviolet light sourced from a UV light source through a light guide. The light irradiation attachment is mounted, and the light guide is inserted from above the jacket to enable light irradiation on the sample and reference through the quartz lid.
The rise in temperature caused by the heat of the irradiated light can be prevented by employing either of the cooling units, namely the electrical cooling unit or the auto-liquid nitrogen cooling unit. This allows for the measurement of the temperature in an isothermal condition.
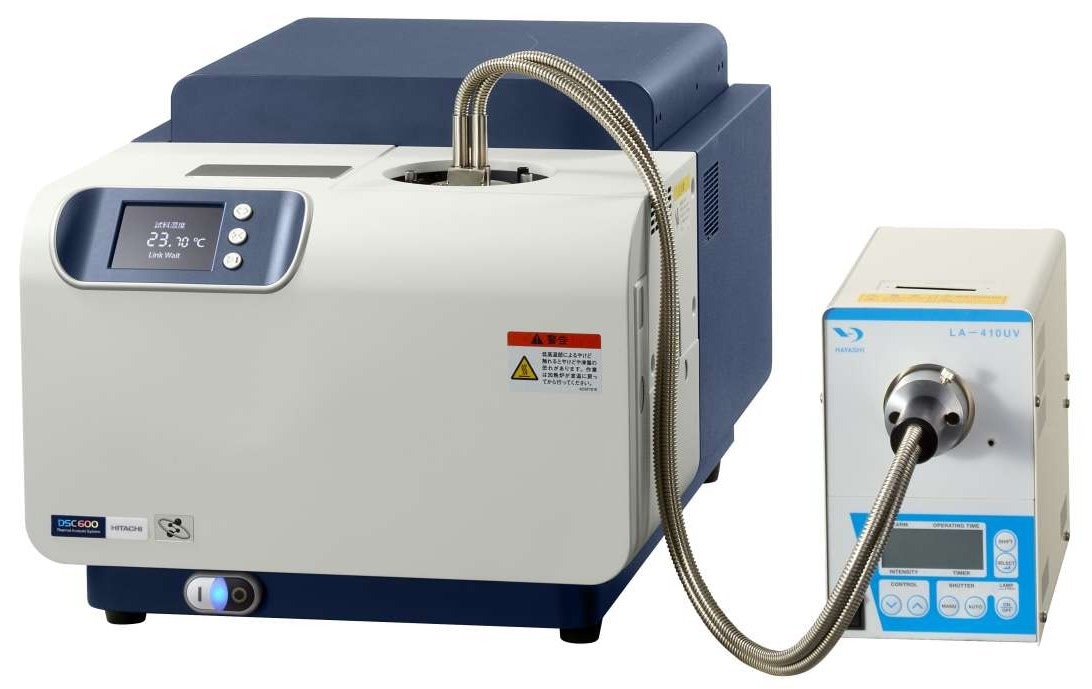
Image 1: Photochemical Reaction Differential Calorimeter. Image Credit: Hitachi High-Tech Analytical Science
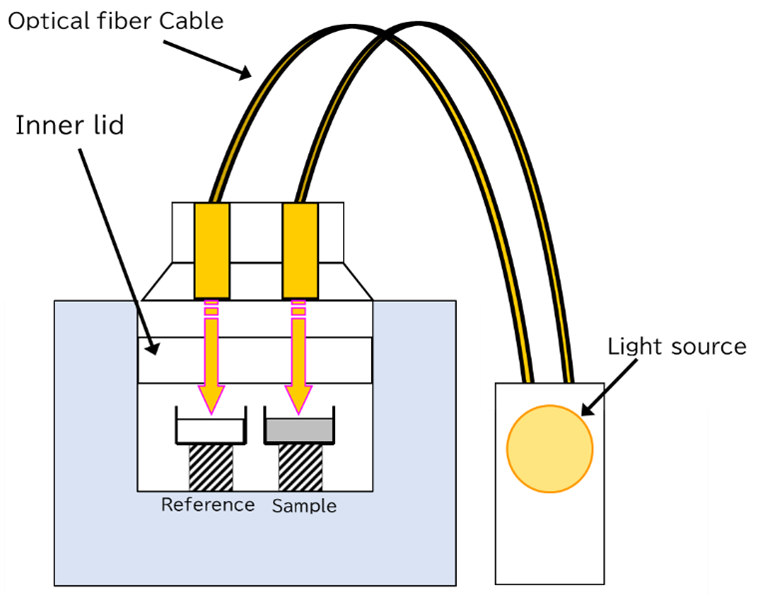
Image 2: PDC Conceptual diagram. Image Credit: Hitachi High-Tech Analytical Science
The Information Provided by PDC
The PDC can determine the amount of heat and curing speed during the curing reaction while varying the exposure wavelength, irradiation intensity, or irradiation time. Figure 1 provides the results of irradiation measurements for various irradiation intensities, such as 1, 2, 10, 20, 100, and 500 mW/cm2.
The amount of exothermic heat tends to increase as the irradiation intensity rises, leading to an increase in the curing reaction amount. The speed of the curing reaction is determined by how quickly the exothermic peak is attained.
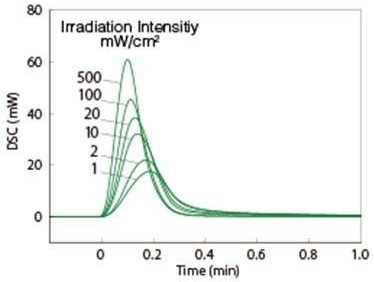
Figure 1: Irradiation intensity difference. Image Credit: Hitachi High-Tech Analytical Science
The Advantages of Using PDC
- High-output UV light source
- Irradiation intensity up to 500 mW/cm2
- Irradiation intensity is easily adjustable
- Same instrument cover as for normal analysis
- Similar operating process and reproducibility improvement
- Wavelength-selective filter
- 254, 313, 365, 405, and 436 nm
- Easily changeable filters
- General purpose DSC possible: easily detachable when light irradiation is not performed.
Measurement Examples with PDC
The PDC measurement results for 1 mg of dry film photoresist, which is utilized in the etching process of printed circuit boards, are presented below.
To investigate the differences in calorific value due to curing, measurements were taken under various conditions of irradiating light wavelength, irradiation intensity and curing reaction temperature. The light source used was a Hg/Xe lamp, and the irradiating light wavelength was selected from wavelength filters.
Figure 2 depicts the DSC measurement results for different irradiation intensities with an irradiation wavelength of 365 nm. The irradiation was initiated one minute after the measurement commenced, and four irradiation intensities were employed, namely 1, 5, 10, and 50 mW/cm2.
The light-curing reaction generated exothermic heat immediately after irradiation, and the reaction terminated after approximately six minutes.
Typically, the higher the irradiation intensity, the greater the number of reaction calories produced. Similarly, when the irradiation intensity is low, the curing reaction does not progress completely, reducing the degree of polymerization.
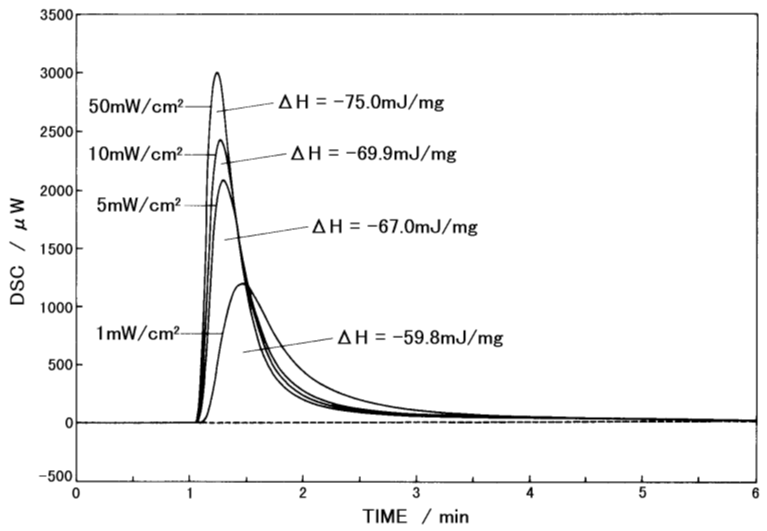
Figure 2: DSC curves for dry film at different irradiating intensities Irradiating wavelength: 356 nm Measurement temperature: 25 °C. Image Credit: Hitachi High-Tech Analytical Science
The peak area integration software was utilized to generate the integral curves shown in Figure 3 based on the measurement results presented in Figure 2.
The vertical axis was set to 100% for the total calorific value, and the percentage of the peak up to each period was illustrated. It is evident from the results that a higher irradiation intensity leads to a more significant initial rise of the integral curve and a faster curing reaction rate.
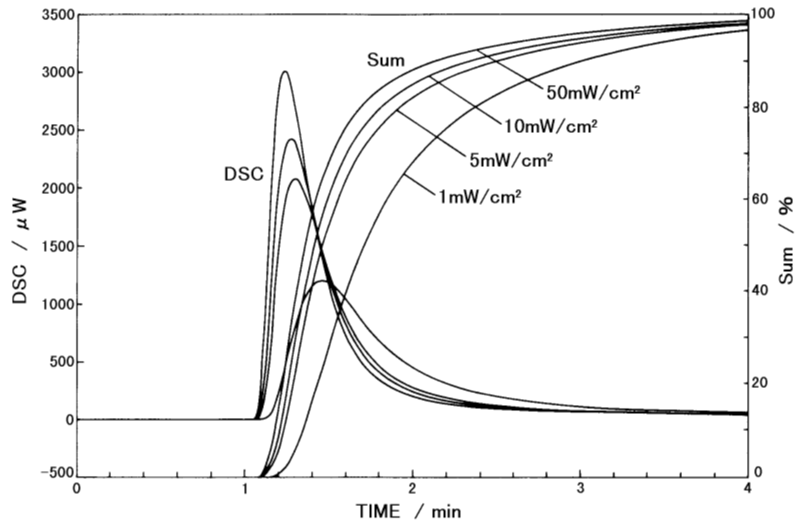
Figure 3: Integral curves of calorific values irradiating wavelength: 356 nm Measurement temperature: 25 °C. Image Credit: Hitachi High-Tech Analytical Science
The DSC measurement results for the different irradiation wavelengths are presented in Figure 4, where the irradiation intensity was 5 mW/cm2, and the wavelengths were chosen from five interference filters.
The peak was notably large for the measurement sample when the irradiation wavelength was 365 or 405 nm, implying that wavelength significantly impacts the reaction rate.
Choosing the appropriate irradiating wavelength is crucial when measuring curing by irradiation.
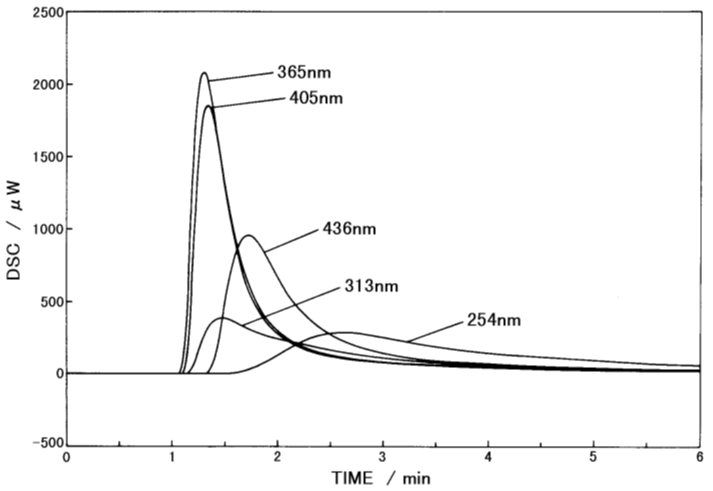
Figure 4: DSC curves for dry film at different irradiating wavelengths irradiating intensity: 5 mW / cm2 Measurement temperature: 25 °C. Image Credit: Hitachi High-Tech Analytical Science
Figure 5 depicts the DSC measurement results obtained at varying temperatures. The results indicate that higher measurement temperatures increase the calorific values and expedite polymerization reactions.
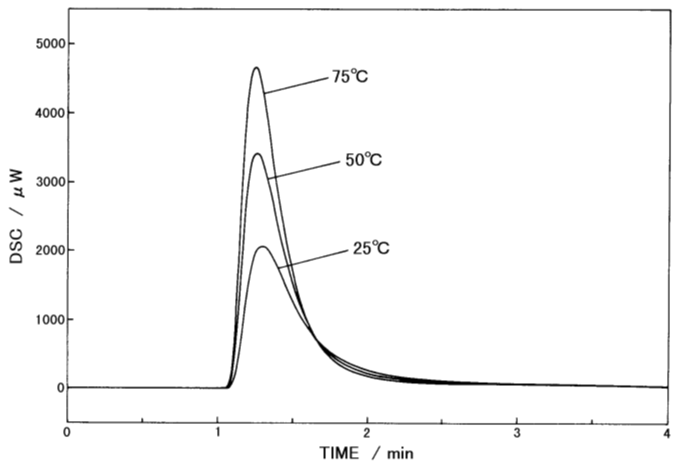
Figure 5: DSC curves for dry film at 4 different measurement temperatures Irradiating intensity: 5 mW / cm2 irradiating wavelength: 356 nm. Image Credit: Hitachi High-Tech Analytical Science
Specifications
Source: Hitachi High-Tech Analytical Science
| . |
. |
| Model |
PDC-8 |
| Temperature range |
Ambient to 150 °C |
| Atmosphere |
Air, Inert gas |
| Wavelength range |
240 to 550 nm |
| Wavelength selection |
254,313,365,405 and 436 nm |
| Irradiation intensity |
Max. 500 mW / cm2 |
| Irradiation intensity adjustment |
0 to 100% |
Hitachi’s Range of DSC Analyzers for Visibly Better Thermal Analysis
The sensitivity and baseline reproducibility of Hitachi’s NEXTA DSC instruments are unparalleled, making them capable of accurately testing and evaluating even the smallest thermal events.
Hitachi’s Real View® camera system, an innovative feature of our instruments, provides real-time observation during measurement, enabling color analysis, dimension change measurement, and a better understanding of unexpected results.
In addition, the images obtained during measurement can be shared with colleagues and customers who may not be familiar with this technique. The DSC200 is a versatile instrument that offers advanced technology for routine applications without any limitations.
The DSC600, with its superior sensitivity and resolution, is specifically designed for advanced materials development and failure analysis, particularly in applied research.

This information has been sourced, reviewed and adapted from materials provided by Hitachi High-Tech Analytical Science.
For more information on this source, please visit Hitachi High-Tech Analytical Science.