Simultaneous thermogravimetric analysis (STA) is a thermal analysis technique that often combines thermogravimetric analysis (TGA) and differential scanning calorimetry (DSC) in a single instrument for simultaneous measurement. STA can be described as the multitool of the thermal analysis world.
This article explains the use of TGA and DSC in combination.
TGA quantifies the sample weight changes, DSC quantifies the heat flow of a sample over a temperature range, and differential thermal analysis (DTA) quantifies the variation in temperature between a sample and a reference material over a temperature range.
A DSC is essentially a DTA that has been calibrated for quantitative enthalpy measurements. The majority of the STAs are TGA or DTA, and some can also be utilized as a DSC.
A wide variety of data can be obtained from one sample by combining different measurement techniques.
How Does STA Work?
Thermogravimetric analysis happens when a sample has been positioned in a furnace on a highly sensitive balance. The mass of the sample is then tracked against temperature or time in an oxidative or inert atmosphere.
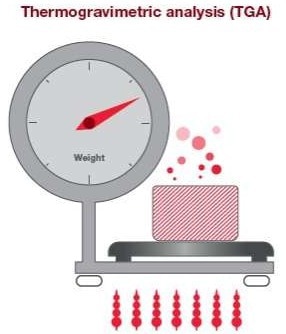
Image Credit: Hitachi High-Tech Analytical Science
The change in mass of the sample is shown against time or temperature. The TGA thermogram of calcium oxalate below clearly shows the percentage drop in mass at different temperatures.
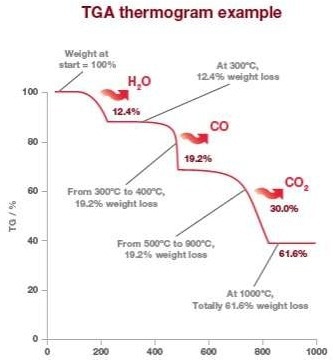
Image Credit: Hitachi High-Tech Analytical Science
TGA alone can give users data on residual solvents, moisture content, and the amount of decomposed or desorbed components released at given temperatures or during a certain period of time. With STA, users get more complete thermal information regarding their sample, such as endothermic and exothermic events. Below is a normal STA output trace for PET.
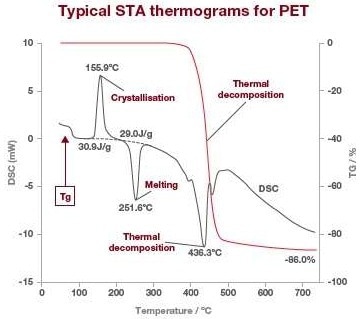
Image Credit: Hitachi High-Tech Analytical Science
The DSC signal is displayed in grey, whereas the TGA signal is in red. The DSC outcomes display the calorimetric analysis for crystallization, glass transition, fusion, and any other exothermic or endothermic reactions, while the TGA signal displays the weight change by thermal decomposition.
What Thermal Properties Does STA Give Information About?
The temperature dependence of weight changes induced by processes such as decomposition, oxidization, dehydration, heat resistance, evaporation, and kinetic analysis can be determined using TG (thermogravimetry).
In DSC (differential scanning calorimetry), users can quantify glass transition, crystallization, melting, specific heat capacity (Cp), chemical reactions like thermal curing, and additional information on TGA weight loss or gain by determining if they are endothermic or exothermic processes, thermal history, specific heat capacity (Cp).
The table below displays the kind of TGA signal users will receive from various phenomena, and the additional DSC data users will get from an STA.
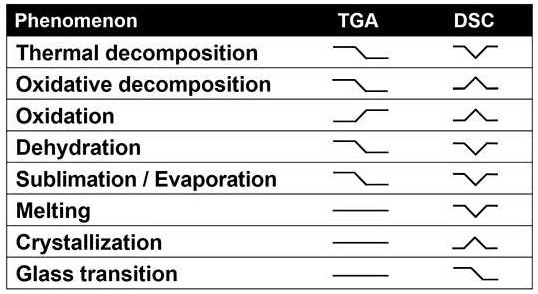
Image Credit: Hitachi High-Tech Analytical Science
How to Interpret Results for an STA to a Specific ASTM Method
As an example, Hitachi has chosen ASTM E2550-11, the standard test technique for thermal stability by thermogravimetry. This test technique involves the evaluation of material thermal stability via the determination of the temperature at which the materials begin to react or decompose and the extent of the mass change with the help of thermogravimetry.
The test technique requires small quantities of material and is applicable over the temperature range from ambient ranging up to 800 °C. The lack of reaction or decomposition indicates thermal stability in this test technique under experimental conditions.
This test method can be applied to solids (film, beads, or powder) or liquids that do not vaporize or sublime in the temperature range of interest. The TGA thermograms below display the thermal stability of various types of polymers.
In this example, the stability of the polymer can be observed where there is no place for weight loss. The temperature at which the polymers lose their thermal stability has been quantified at the intercept of the baseline and where the weight loss occurs at the fastest rate.
In this example, the most stable polymer is polytetrafluorethylene (PTFE), and the least stable is polymethyl methacrylate (PMMA). It is also worth mentioning that the polyamide weight loss at nearly 100 °C is due to water loss and not due to thermal stability.
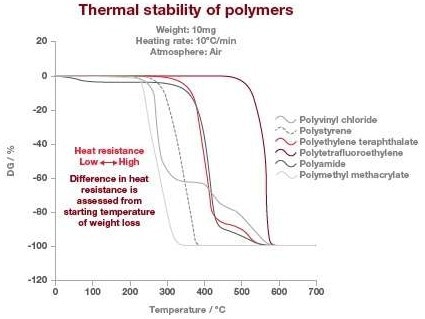
Image Credit: Hitachi High-Tech Analytical Science
What are the Advantages of Using STA?
Using STA means that users get two experiments in one with identical parameters for both data sets to remove the uncertainty caused by sample preparation and varying instruments.
Furthermore, both data sets are gathered on the same sample in the same furnace with a similar gas flow to provide an improved correlation of time or heat flow and time or mass change phenomena in time-sensitive operations.
STA instruments are ideal for research and routine applications in polymers, food, nanomaterials, pharmaceuticals, metals, and oil, as it integrates analysis methods in a single instrument.
Hitachi’s Range of STA Analyzers for Visibly Better Thermal Analysis
The NEXTA STA instruments detect minute weight changes across a wide temperature range, ensuring the material meets the required performance and quality standards. Depending on the ambient temperature, the STA200, STA200RV, and STA300 will help to guarantee that a user's material fulfills the necessary performance and quality standards.
The innovative Real View® camera system integrates effortlessly with the availability of the NEXTA STA Series to note changes in the sample status during the analysis in real-time.
Images reveal sample size, shape, color, and other properties changes. The images are recorded and are automatically linked to the thermal data by timestamp in an automatic manner. Users can also combine RealView® with the Auto Sampler to track changes to their samples while automatically examining various samples at once.

This information has been sourced, reviewed and adapted from materials provided by Hitachi High-Tech Analytical Science.
For more information on this source, please visit Hitachi High-Tech Analytical Science.