Cast iron represents a category of iron alloys characterized by a carbon content ranging from 1.8% to 4.0% w/w, coupled with 1% to 3% w/w of silicon.
The control of carbon content is crucial in shaping the properties of cast iron, with iron alloys having lower carbon content being classified as steel. Given its widespread applications across various industries, this alloy's reliable production and analysis are paramount.
In the characterization of iron alloys, combustion analysis employing infrared spectroscopy is the current benchmark technique for determining carbon content.
Recent advancements in detector windows have opened the door to carbon analysis through energy-dispersive X-Ray fluorescence (EDXRF), a swift and non-destructive method for elemental analysis.
In this article, the Thermo Scientific™ ARL QUANT’X™ Spectrometer is employed to consistently and dependably analyze the composition of a cast iron sample using a series of calibration curves.
Instrumentation
The ARL QUANT’X EDXRF Spectrometer is equipped with a 50- W, 50- kV rhodium (Rh) anode X-Ray tube, featuring a filter wheel with nine selectable filter positions, and boasts a state-of-the-art silicon drift detector (SDD500G) with a thin, 0.9- µm graphene window.
This specialized window exhibits high transparency to low-energy X-Rays, such as those emitted by carbon atoms, allowing for the detection of all elements in the periodic table ranging from carbon (Z = 6) to americium (Z = 95).
The ARL QUANT’X Spectrometer offers great versatility as an analytical tool thanks to its sample spinner, 10- or 20-position sample changer, and the ability to analyze in air, helium, or vacuum environments.
Calibration Standards and Sample Preparation
To establish calibration curves for the elements C, Si, P, Cr, Mn, and Ni, eight VASKUT cast iron-certified reference materials (CRMs) were utilized. Before the measurement, the standards underwent surfacing using 120-grit Al2O3 sandpaper on a Herzog circular sander. Table 1 shows the certified elemental concentration ranges for these standards.
Table 1. Concentration ranges and calibration data. Source: Thermo Fisher Scientific - Elemental Analyzers and Phase Analyzers
| Element |
Conc. range (% w/w) |
RMSE (% w/w) |
R² |
| C |
2.32–3.89 |
0.16 |
0.9197 |
| Si |
0.10–3.80 |
0.10 |
0.9943 |
| P |
0.03–0.80 |
0.019 |
0.9961 |
| S |
0.01–0.12 |
0.005 |
0.9920 |
| Cr |
0.03–0.54 |
0.006 |
0.9990 |
| Mn |
0.20–1.88 |
0.03 |
0.9982 |
| Ni |
0.02–0.64 |
0.003 |
0.9998 |
Measurement Conditions
The elemental composition of the cast iron samples was determined using only two measurement conditions, as presented in Table 2. Carbon and other light elements were measured under the Low Za condition, employing an excitation voltage of 4 kV and no primary beam filter.
Calibration necessitated a 600 s live time to achieve sufficient carbon intensity. For heavier elements, a second condition (Mid Za) with an excitation voltage of 16 kV and a thin Pd primary beam filter was employed, using a 120 s measurement live time.
All measurements were performed under vacuum conditions, mandatory for detecting carbon X-Ray fluorescence and enhancing sensitivity for light elements.
Carbon Kα Signal
Figure 1A displays the spectrum for standard VASKUT 185, obtained under the Low Za measurement condition, with a carbon content of 3.28% w/w. Although well-defined, the carbon signal is relatively small compared to other elemental lines in the spectrum.
Figure 1B overlays the Low Za spectra obtained for all standards, focusing on the energy range between 0–0.5 keV. As depicted, different carbon concentrations result in distinct carbon Kα intensities.
The region spanning 0.16–0.38 keV, encompassing the carbon peak, was utilized to derive the net carbon Kα peak intensity. A linear correction was applied for the background, attributing any remaining intensity solely to the carbon Kα signal.
Table 2. Measurement conditions used to determine cast iron elemental composition. Source: Thermo Fisher Scientific - Elemental Analyzers and Phase Analyzers
| Condition |
Filter |
Voltage (kV) |
Current |
Atmosphere |
Live time (s) |
Analytes |
| Low Za |
No filter |
4 |
Auto |
Vacuum |
600 |
C, Si, P, S |
| Mid Za |
Pd thin |
16 |
Auto |
Vacuum |
120 |
Cr, Mn, Fe, Ni |
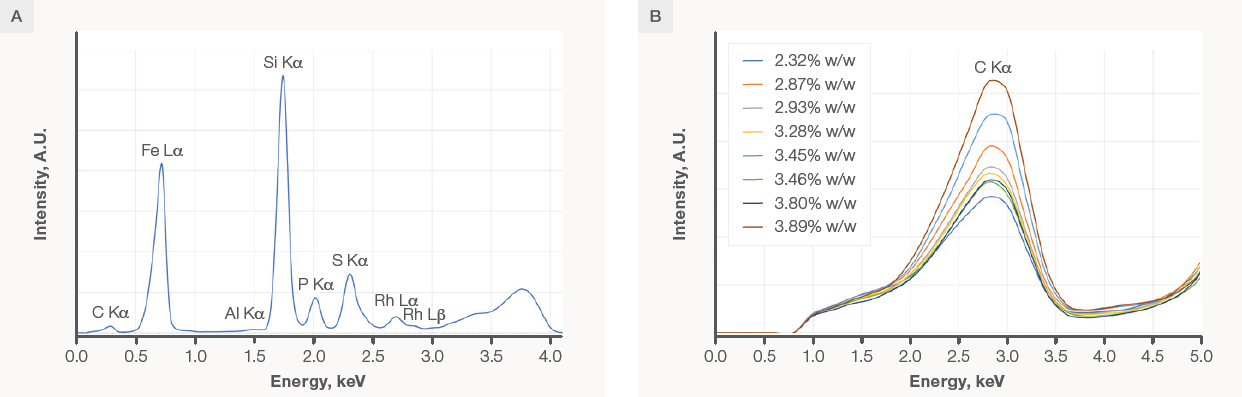
Figure 1. A) Full spectrum for standard VASKUT 185. B) An overlay of the spectra obtained for all eight VASKUT standards, zoomed in on the carbon peak. All spectra were obtained with condition Low Za (4 kV, no filter). Image Credit: Thermo Fisher Scientific - Elemental Analyzers and Phase Analyzers
Calibration Results
Figure 2 displays the calibration curves for the primary alloying elements. No matrix correction is usually necessary, as the elemental line intensity exhibits a linear relationship with concentration. However, a single influence coefficient is needed for Si and Ni to address matrix effects.
Consequently, the matrix-corrected intensity becomes a linear function of concentration. The root mean squared error (RMSE) and correlation coefficient (R2) for each element's calibration are presented in Table 1, demonstrating satisfactory outcomes for all elements.
Notably, the carbon (C) calibration curve affirms the feasibility of quantifying carbon in cast iron using the ARL QUANT’X Spectrometer, equipped with the SDD500G detector featuring its ultra-thin graphene window.
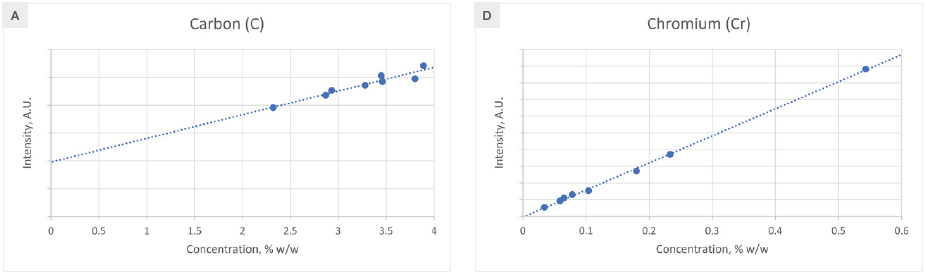
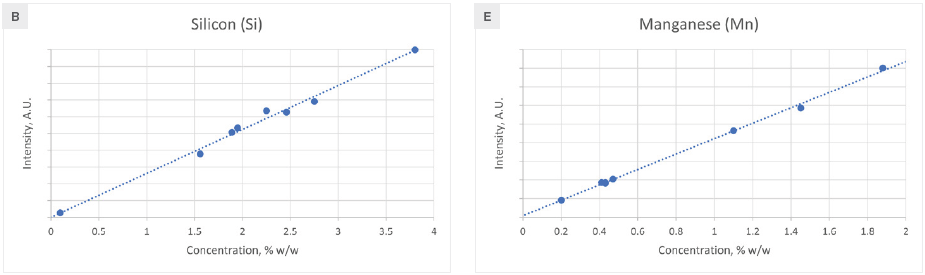
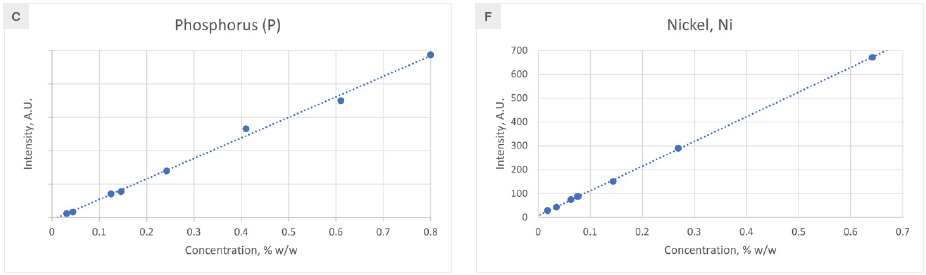
Figure 2. Calibration curves for elements found in cast iron. Image Credit: Thermo Fisher Scientific - Elemental Analyzers and Phase Analyzers
Repeatability
To gauge the short-term repeatability or precision of the analysis, standard VASKUT 185 underwent ten consecutive measurements. Table 3 compares the average concentration of these measurements to the certified concentration for each element, revealing that precision is contingent on the measurement time.
Data was collected at additional measurement times (400 and 80 s, 200 and 40 s, as well as 100 and 20 s live times) apart from those used in the calibration (i.e., 120 and 600 s). Remarkably, even at the shortest measurement times, the results remain sufficiently precise, ensuring a dependable analysis.
Table 3. Repeatability results for the VASKUT 185 cast iron standard at different live times. Source: Thermo Fisher Scientific - Elemental Analyzers and Phase Analyzers
| Result (% w/w) |
Live time (s) |
C |
Si |
P |
S |
|
Live time (s) |
Cr |
Mn |
Ni |
| Certified |
|
3.28 |
1.89 |
0.146 |
0.062 |
|
|
0.233 |
0.43 |
0.269 |
Average
1-sigma |
600 |
3.37
0.04 |
1.966
0.0017 |
0.1440
0.0003 |
0.1255
0.0002 |
|
120 |
0.2364
0.0014 |
0.435
0.004 |
0.281
0.003 |
Average
1-sigma |
400 |
3.19
0.03 |
1.899
0.0017 |
0.1337
0.0004 |
0.1212
0.0004 |
|
80 |
0.2302
0.0016 |
0.433
0.003 |
0.2721
0.003 |
Average
1-sigma |
200 |
3.09
0.06 |
1.870
0.0017 |
0.1301
0.0002 |
0.1193
0.0002 |
|
40 |
0.2281
0.0019 |
0.436
0.005 |
0.269
0.003 |
Average
1-sigma |
100 |
3.34
0.09 |
1.992
0.006 |
0.1485
0.0013 |
0.1277
0.0005 |
|
20 |
0.241
0.004 |
0.438
0.007 |
0.283
0.003 |
Conclusions
This article effectively demonstrates the ARL QUANT’X EDXRF Spectrometer's capability to quantify various elements in cast iron, including C, Si, P, S, Cr, Mn, and Ni. The generation of straightforward calibration curves requiring minimal matrix corrections was successful for all elements.
The repeatability data showcases exceptional accuracy and precision, even at short measurement times, further validating the applicability of EDXRF for cast iron composition analysis. The ARL QUANT’X Spectrometer, enhanced with the latest detector window technology, significantly broadens the capabilities of EDXRF analysis.

This information has been sourced, reviewed and adapted from materials provided by Thermo Fisher Scientific - Elemental Analyzers and Phase Analyzers.
For more information on this source, please visit Thermo Fisher Scientific - Elemental Analyzers and Phase Analyzers.